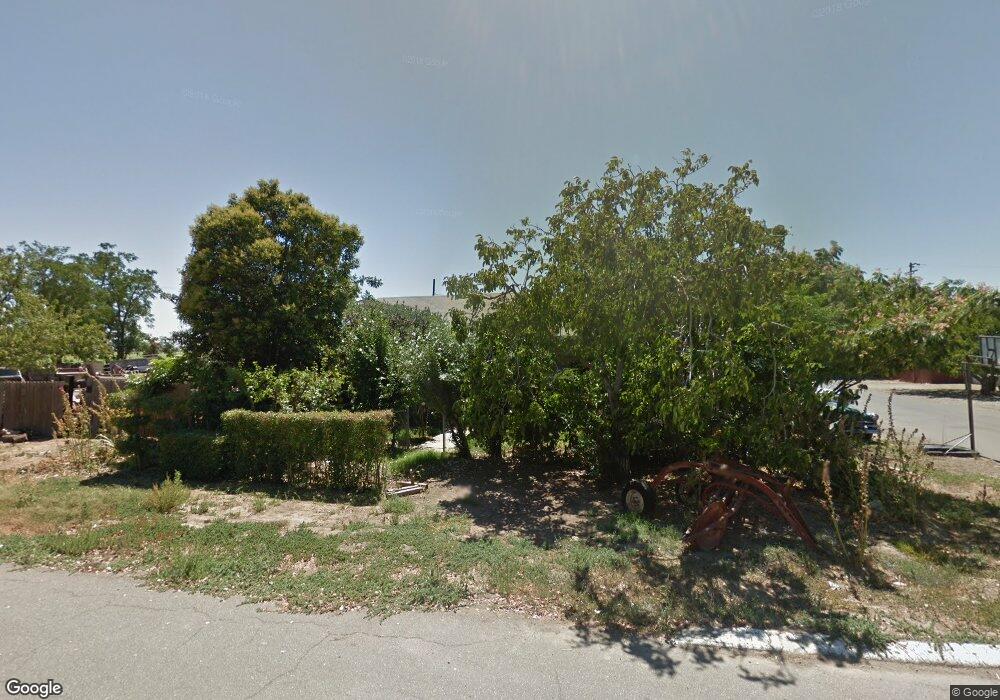
22101 G St Crows Landing, CA 95313
Estimated Value: $275,000 - $345,000
3
Beds
1
Bath
1,166
Sq Ft
$268/Sq Ft
Est. Value
About This Home
This home is located at 22101 G St, Crows Landing, CA 95313 and is currently estimated at $312,461, approximately $267 per square foot. 22101 G St is a home located in Stanislaus County with nearby schools including Orestimba High School.
Create a Home Valuation Report for This Property
The Home Valuation Report is an in-depth analysis detailing your home's value as well as a comparison with similar homes in the area
Tax History
| Year | Tax Paid | Tax Assessment Tax Assessment Total Assessment is a certain percentage of the fair market value that is determined by local assessors to be the total taxable value of land and additions on the property. | Land | Improvement |
|---|---|---|---|---|
| 2025 | $715 | $53,736 | $12,437 | $41,299 |
| 2024 | $696 | $52,684 | $12,194 | $40,490 |
| 2023 | $562 | $41,726 | $11,955 | $29,771 |
| 2022 | $548 | $40,909 | $11,721 | $29,188 |
| 2021 | $530 | $40,108 | $11,492 | $28,616 |
| 2020 | $262 | $17,037 | $11,375 | $5,662 |
| 2019 | $259 | $16,703 | $11,152 | $5,551 |
| 2018 | $249 | $16,377 | $10,934 | $5,443 |
| 2017 | $254 | $16,057 | $10,720 | $5,337 |
| 2016 | $567 | $45,399 | $10,510 | $34,889 |
| 2015 | $579 | $44,718 | $10,353 | $34,365 |
| 2014 | $568 | $43,843 | $10,151 | $33,692 |
Source: Public Records
Map
Nearby Homes
- 19054 California 33
- 24 Armstrong Rd
- 18401 Davis Rd
- 0 Draper Rd Unit 26489134
- 18413 Sycamore Ave
- 1137 Apricot Ave
- 13807 Carpenter Rd
- 403 Elfers Rd
- 425 Elfers Rd
- 0 E Stuhr Rd
- 572 St Helena Dr
- 662 Cedar Mountain Dr
- 728 R St
- 751 Banff Dr
- 4060 Orestimba Rd
- 1613 Fig Ave
- 1029 Main St
- 449 D Arpino Ct
- 613 Ranee Ct
- 407 Northampton Way
Your Personal Tour Guide
Ask me questions while you tour the home.