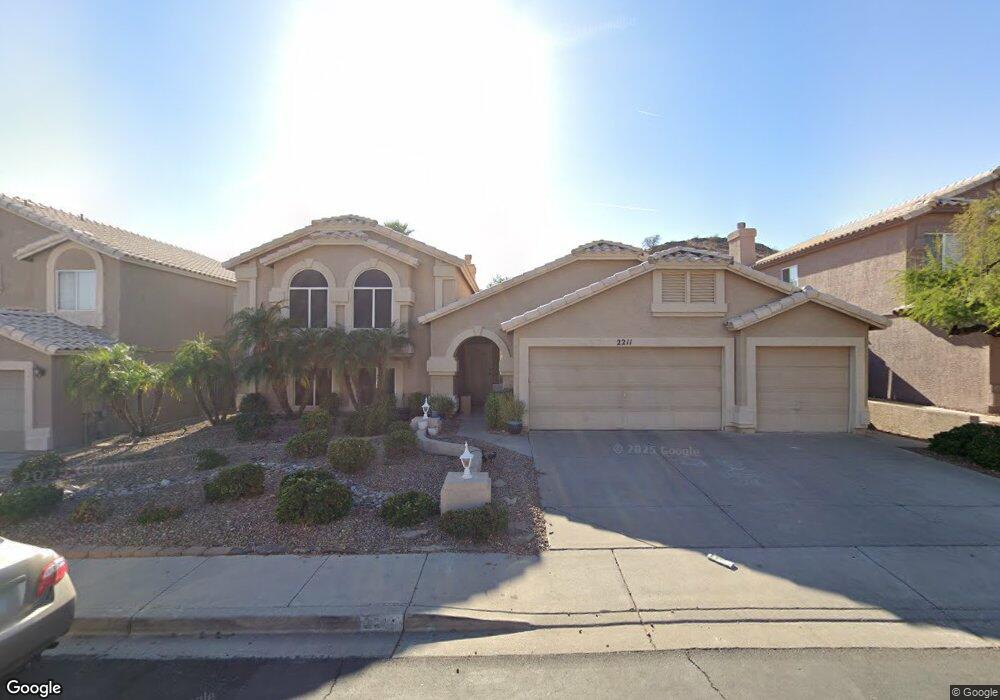
2211 E Granite View Dr Phoenix, AZ 85048
Ahwatukee NeighborhoodEstimated Value: $624,507 - $744,000
--
Bed
4
Baths
2,582
Sq Ft
$274/Sq Ft
Est. Value
About This Home
This home is located at 2211 E Granite View Dr, Phoenix, AZ 85048 and is currently estimated at $708,127, approximately $274 per square foot. 2211 E Granite View Dr is a home located in Maricopa County with nearby schools including Kyrene Monte Vista Elementary School, Kyrene Altadeña Middle School, and Desert Vista High School.
Ownership History
Date
Name
Owned For
Owner Type
Purchase Details
Closed on
Jun 28, 2023
Sold by
Ong Franky and Ong Chinh
Bought by
Ong Family Trust and Ong
Current Estimated Value
Purchase Details
Closed on
Aug 13, 2003
Sold by
Ong Franky
Bought by
Ong Franky and Ong Chinh
Purchase Details
Closed on
Oct 15, 1998
Sold by
Spangler Steven B and Spangler Susan A
Bought by
Ong Franky
Home Financials for this Owner
Home Financials are based on the most recent Mortgage that was taken out on this home.
Original Mortgage
$167,200
Interest Rate
6.54%
Mortgage Type
New Conventional
Create a Home Valuation Report for This Property
The Home Valuation Report is an in-depth analysis detailing your home's value as well as a comparison with similar homes in the area
Home Values in the Area
Average Home Value in this Area
Purchase History
| Date | Buyer | Sale Price | Title Company |
|---|---|---|---|
| Ong Family Trust | -- | None Listed On Document | |
| Ong Franky | -- | -- | |
| Ong Franky | $209,000 | Security Title Agency |
Source: Public Records
Mortgage History
| Date | Status | Borrower | Loan Amount |
|---|---|---|---|
| Previous Owner | Ong Franky | $167,200 |
Source: Public Records
Tax History
| Year | Tax Paid | Tax Assessment Tax Assessment Total Assessment is a certain percentage of the fair market value that is determined by local assessors to be the total taxable value of land and additions on the property. | Land | Improvement |
|---|---|---|---|---|
| 2025 | $3,501 | $38,963 | -- | -- |
| 2024 | $3,324 | $37,108 | -- | -- |
| 2023 | $3,324 | $49,710 | $9,940 | $39,770 |
| 2022 | $3,166 | $39,200 | $7,840 | $31,360 |
| 2021 | $3,303 | $36,410 | $7,280 | $29,130 |
| 2020 | $3,220 | $33,710 | $6,740 | $26,970 |
| 2019 | $3,118 | $32,020 | $6,400 | $25,620 |
| 2018 | $3,011 | $30,910 | $6,180 | $24,730 |
| 2017 | $2,874 | $30,180 | $6,030 | $24,150 |
| 2016 | $2,912 | $29,800 | $5,960 | $23,840 |
| 2015 | $2,607 | $30,260 | $6,050 | $24,210 |
Source: Public Records
Map
Nearby Homes
- 14644 S 24th Place
- 2451 E Indigo Brush Rd
- 2139 E Tecoma Rd Unit 35G2
- 13811 S Canyon Dr
- 14004 S 19th Place Unit 22
- 1930 E Desert Willow Dr
- 1805 E Rocky Slope Dr
- 13829 S Canyon Dr Unit 33
- 14012 S Canyon Dr Unit 20
- 15431 S 22nd St
- 2710 E Rock Wren Rd
- 15432 S 21st Place
- 14844 S 27th Way Unit 37C
- 1744 E Desert Willow Dr
- 2702 E Cathedral Rock Dr
- 2134 E Barkwood Rd Unit 20
- 15430 S 26th Way
- 14008 S Rockhill Rd Unit 40
- 2750 E Rock Wren Rd
- 2115 E Barkwood Rd Unit 23
- 2215 E Granite View Dr
- 2221 E Granite View Dr
- 2212 E Granite View Dr
- 2206 E Granite View Dr
- 2201 E Granite View Dr
- 2216 E Granite View Dr
- 2227 E Granite View Dr
- 2222 E Granite View Dr
- 14431 S 22nd St
- 14442 S 22nd St
- 2221 E Rockledge Rd
- 2231 E Granite View Dr
- 14436 S 22nd St
- 2228 E Granite View Dr
- 2217 E Rockledge Rd
- 14425 S 22nd St
- 14430 S 22nd St
- 2225 E Rockledge Rd
- 2232 E Granite View Dr
- 2235 E Granite View Dr
Your Personal Tour Guide
Ask me questions while you tour the home.