Estimated Value: $269,376
--
Bed
--
Bath
2,010
Sq Ft
$134/Sq Ft
Est. Value
About This Home
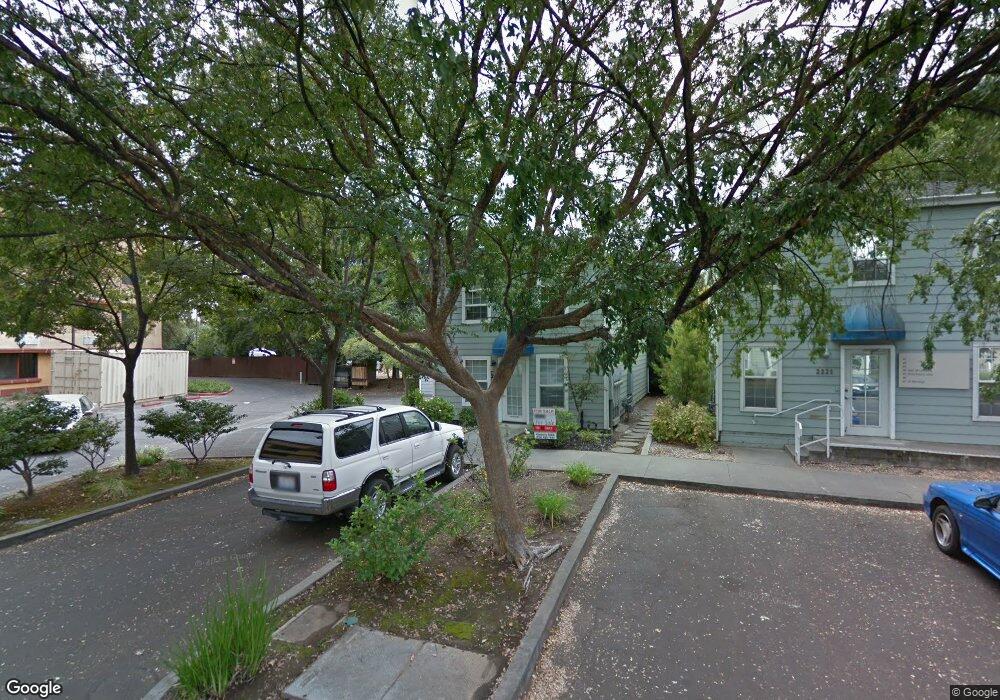
This home is located at 2211 Saint George Ln Unit 2, Chico, CA 95926 and is currently estimated at $269,376, approximately $134 per square foot. 2211 Saint George Ln Unit 2 is a home located in Butte County with nearby schools including McManus (John A.) Elementary School, Bidwell Junior High School, and Pleasant Valley High School.
Ownership History
Date
Name
Owned For
Owner Type
Purchase Details
Closed on
Feb 21, 2020
Sold by
Sgt Infinity Investments Llc
Bought by
Sledge Brandon
Current Estimated Value
Purchase Details
Closed on
Sep 27, 2016
Sold by
Trott Steven G and Trott Melissa G
Bought by
Sgt Infinity Investments Llc
Purchase Details
Closed on
May 13, 2015
Sold by
Trott Steven G and Trott Melissa G
Bought by
The Trott Family Trust
Purchase Details
Closed on
Aug 28, 2012
Sold by
Thompson Marshall
Bought by
Trott Steven G and Trott Melissa G
Home Financials for this Owner
Home Financials are based on the most recent Mortgage that was taken out on this home.
Original Mortgage
$131,000
Interest Rate
3.47%
Mortgage Type
Seller Take Back
Create a Home Valuation Report for This Property
The Home Valuation Report is an in-depth analysis detailing your home's value as well as a comparison with similar homes in the area
Home Values in the Area
Average Home Value in this Area
Purchase History
| Date | Buyer | Sale Price | Title Company |
|---|---|---|---|
| Sledge Brandon | $225,000 | Mid Valley Title & Escrow Co | |
| Sgt Infinity Investments Llc | -- | None Available | |
| The Trott Family Trust | -- | None Available | |
| Trott Steven G | $156,000 | Fidelity Natl Title Co Of Ca |
Source: Public Records
Mortgage History
| Date | Status | Borrower | Loan Amount |
|---|---|---|---|
| Previous Owner | Trott Steven G | $131,000 |
Source: Public Records
Tax History Compared to Growth
Tax History
| Year | Tax Paid | Tax Assessment Tax Assessment Total Assessment is a certain percentage of the fair market value that is determined by local assessors to be the total taxable value of land and additions on the property. | Land | Improvement |
|---|---|---|---|---|
| 2025 | $2,679 | $246,065 | $65,616 | $180,449 |
| 2024 | $2,679 | $241,241 | $64,330 | $176,911 |
| 2023 | $2,647 | $236,512 | $63,069 | $173,443 |
| 2022 | $2,604 | $231,876 | $61,833 | $170,043 |
| 2021 | $2,555 | $227,330 | $60,621 | $166,709 |
| 2020 | $1,993 | $175,649 | $56,297 | $119,352 |
| 2019 | $1,957 | $172,206 | $55,194 | $117,012 |
| 2018 | $1,921 | $168,830 | $54,112 | $114,718 |
| 2017 | $1,881 | $165,520 | $53,051 | $112,469 |
| 2016 | $1,718 | $162,275 | $52,011 | $110,264 |
| 2015 | $1,718 | $159,838 | $51,230 | $108,608 |
| 2014 | -- | $156,708 | $50,227 | $106,481 |
Source: Public Records
Map
Nearby Homes
- 1 Cottage Cir
- 498 E 8th Ave
- 598 El Reno Dr
- 1712 Sherman Ave
- 9 Trieste Way
- 476 E 7th Ave
- 16 El Cerrito Dr
- 2165 Ceres Ave
- 1094 Manzanita Ave
- 282 Connors Ave
- 1603 Plumas Way
- 406 Panama Ave
- 1420 Sherman Ave
- 1407 Sunset Ave
- 342 Mission Serra Terrace
- 1186 Patricia Dr
- 16 Petaluma Ct
- 701 E Lassen Ave Unit 38
- 701 E Lassen Ave Unit 114
- 701 E Lassen Ave Unit 279
- 2211 Saint George Ln Unit 1
- 2211 Saint George Ln Unit 4
- 2211 Saint George Ln
- 2211 St George Ln Unit 2
- 2211 St George Ln
- 2211 St George Ln Unit 4
- 2211 St George Ln Unit 3
- 2221 Saint George Ln
- 2221 Saint George Ln Unit 5
- 2221 Saint George Ln Unit 4
- 2221 Saint George Ln Unit 6
- 2231St. George Ln Unit 50
- 2231 Saint George Ln Unit 26
- 2231 Saint George Ln Unit 60
- 2231 Saint George Ln Unit 80
- 2231 Saint George Ln Unit 70
- 2231 Saint George Ln Unit 50
- 2231 Saint George Ln
- 2231 St George Ln Unit 60
- 2231 St George Ln Unit 80