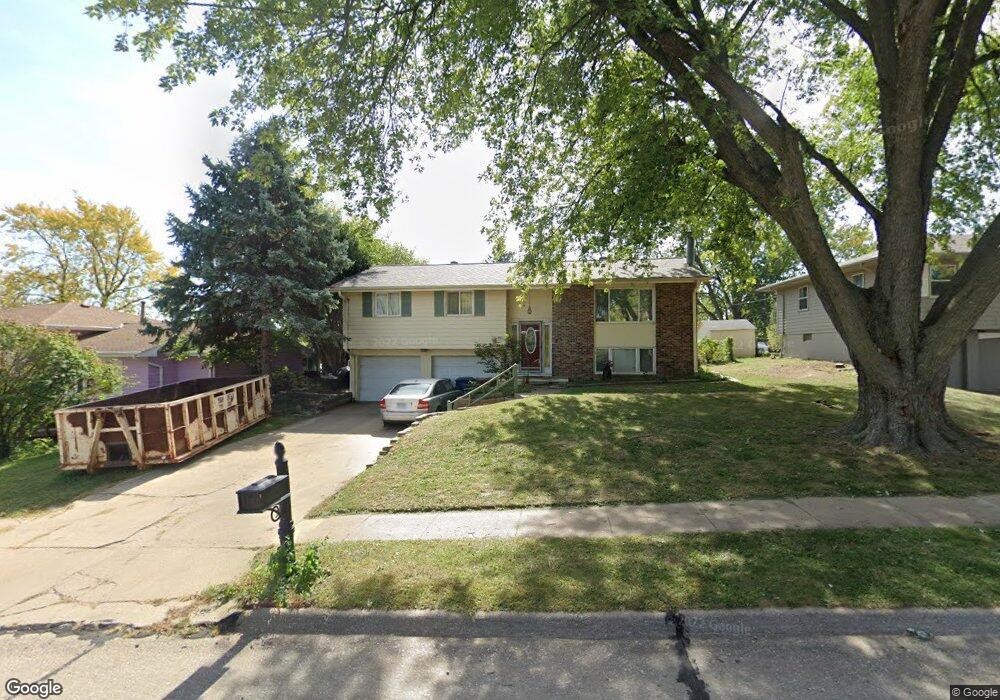
2211 Twinridge Dr Bellevue, NE 68005
Estimated Value: $254,088 - $274,000
3
Beds
2
Baths
1,932
Sq Ft
$137/Sq Ft
Est. Value
About This Home
This home is located at 2211 Twinridge Dr, Bellevue, NE 68005 and is currently estimated at $264,522, approximately $136 per square foot. 2211 Twinridge Dr is a home located in Sarpy County with nearby schools including Twin Ridge Elementary School, Logan Fontenelle Middle School, and Bellevue East High School.
Ownership History
Date
Name
Owned For
Owner Type
Purchase Details
Closed on
Jul 21, 2011
Sold by
Mattera Anthony and Hall Carla
Bought by
Pepper Michael S and Pepper Heidi M
Current Estimated Value
Home Financials for this Owner
Home Financials are based on the most recent Mortgage that was taken out on this home.
Original Mortgage
$128,653
Outstanding Balance
$87,415
Interest Rate
4.25%
Mortgage Type
FHA
Estimated Equity
$177,107
Purchase Details
Closed on
Jun 22, 2007
Sold by
Benton Edward A and Benton Anna R
Bought by
Mattera Anthony and Hall Carla
Home Financials for this Owner
Home Financials are based on the most recent Mortgage that was taken out on this home.
Original Mortgage
$143,000
Interest Rate
6.19%
Purchase Details
Closed on
Apr 20, 2002
Sold by
Kramer Marcus U and Kramer Maria Remedios
Bought by
Benton Edward A and Benton Anna R
Home Financials for this Owner
Home Financials are based on the most recent Mortgage that was taken out on this home.
Original Mortgage
$112,335
Interest Rate
7.11%
Create a Home Valuation Report for This Property
The Home Valuation Report is an in-depth analysis detailing your home's value as well as a comparison with similar homes in the area
Home Values in the Area
Average Home Value in this Area
Purchase History
| Date | Buyer | Sale Price | Title Company |
|---|---|---|---|
| Pepper Michael S | $132,000 | Omaha Title & Escrow Inc | |
| Mattera Anthony | $143,000 | Mrt | |
| Benton Edward A | $117,000 | -- |
Source: Public Records
Mortgage History
| Date | Status | Borrower | Loan Amount |
|---|---|---|---|
| Open | Pepper Michael S | $128,653 | |
| Previous Owner | Mattera Anthony | $143,000 | |
| Previous Owner | Benton Edward A | $112,335 |
Source: Public Records
Tax History Compared to Growth
Tax History
| Year | Tax Paid | Tax Assessment Tax Assessment Total Assessment is a certain percentage of the fair market value that is determined by local assessors to be the total taxable value of land and additions on the property. | Land | Improvement |
|---|---|---|---|---|
| 2025 | $4,005 | $239,944 | $38,000 | $201,944 |
| 2024 | $4,443 | $229,502 | $34,000 | $195,502 |
| 2023 | $4,443 | $210,395 | $30,000 | $180,395 |
| 2022 | $3,787 | $175,988 | $28,000 | $147,988 |
| 2021 | $3,401 | $156,342 | $28,000 | $128,342 |
| 2020 | $3,360 | $153,981 | $23,000 | $130,981 |
| 2019 | $3,067 | $141,417 | $23,000 | $118,417 |
| 2018 | $2,931 | $138,774 | $23,000 | $115,774 |
| 2017 | $2,907 | $136,712 | $23,000 | $113,712 |
| 2016 | $2,766 | $132,977 | $23,000 | $109,977 |
| 2015 | $2,680 | $129,565 | $23,000 | $106,565 |
| 2014 | $2,660 | $127,759 | $23,000 | $104,759 |
| 2012 | -- | $123,628 | $23,000 | $100,628 |
Source: Public Records
Map
Nearby Homes
- 2113 Twinridge Dr
- 2203 Lloyd St
- 2303 Lloyd St
- 2308 Julie Cir
- 2208 Greensboro Ave
- 2212 Greensboro Ave
- 1409 Thomas Dr
- 2303 Greensboro Ave
- 2108 Randall Dr
- 1213 Willow Ave
- 1206 Skyview Dr
- 2804 Greensboro Ave
- 2813 Bryan Ave
- 1302 Wilroy Rd Unit 1
- 129 Cedar Cir
- 1509 Brenda Dr
- 1212 W 16th Ave
- 1101 Potter Rd
- 1603 Cascio Dr
- 20 Martinview Rd
- 2209 Twinridge Dr
- 2207 Twinridge Dr
- 2216 Victoria Ave
- 1203 Thomas Dr
- 2214 Victoria Ave
- 2216 Twinridge Dr
- 2214 Twinridge Dr
- 2212 Twinridge Dr
- 2205 Twinridge Dr
- 2212 Victoria Ave
- 1204 Thomas Dr
- 1206 Thomas Dr
- 1103 Thomas Dr
- 2210 Twinridge Dr
- 1202 Thomas Dr
- 2302 Victoria Ave
- 1108 Thomas Dr
- 2203 Twinridge Dr
- 2210 Victoria Ave
- 2208 Twinridge Dr