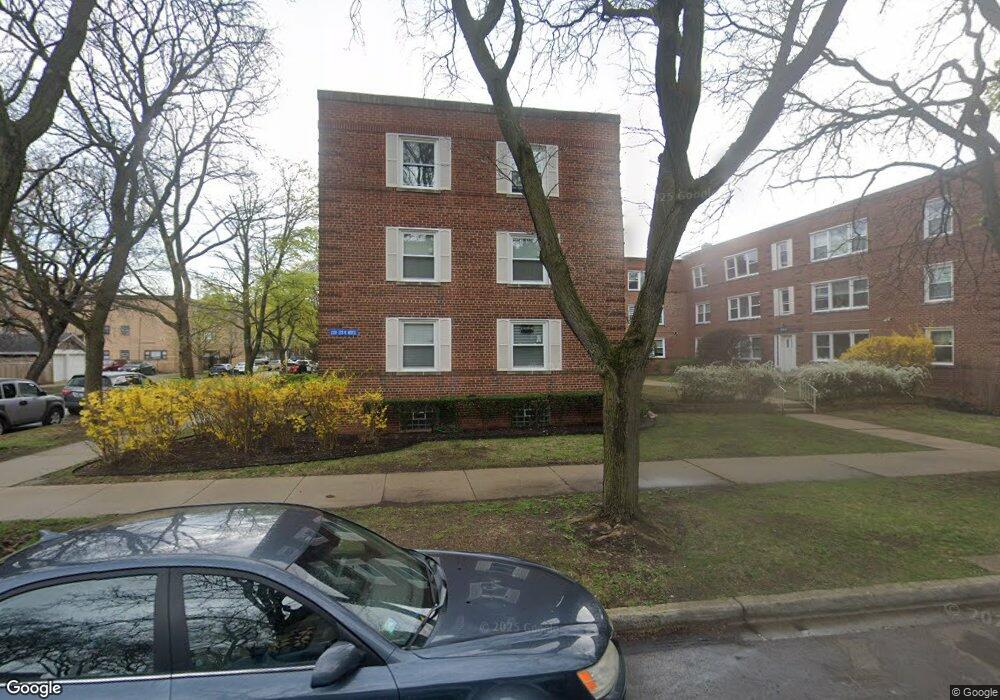
2211 W Morse Ave Unit 22112 Chicago, IL 60645
West Ridge NeighborhoodEstimated Value: $150,344 - $160,000
--
Bed
--
Bath
22,680
Sq Ft
$7/Sq Ft
Est. Value
About This Home
This home is located at 2211 W Morse Ave Unit 22112, Chicago, IL 60645 and is currently estimated at $155,836, approximately $6 per square foot. 2211 W Morse Ave Unit 22112 is a home located in Cook County with nearby schools including George Armstrong Elementary School, Sullivan High School, and God's Battle Axe Prayer Academy.
Ownership History
Date
Name
Owned For
Owner Type
Purchase Details
Closed on
Apr 17, 1998
Sold by
Koshaba Wahid and Koshaba Nahla
Bought by
Tapia Jesus and Tapia Ramona
Current Estimated Value
Home Financials for this Owner
Home Financials are based on the most recent Mortgage that was taken out on this home.
Original Mortgage
$62,100
Outstanding Balance
$11,871
Interest Rate
7.18%
Estimated Equity
$143,965
Purchase Details
Closed on
Jun 30, 1997
Sold by
Odisho Paul and Odisho Linda
Bought by
Koshaba Wahid and Koshaba Nahla
Home Financials for this Owner
Home Financials are based on the most recent Mortgage that was taken out on this home.
Original Mortgage
$49,360
Interest Rate
7.56%
Mortgage Type
FHA
Purchase Details
Closed on
Mar 31, 1995
Sold by
Abo Saif Boshra M and Abo Saif Awatif
Bought by
Odisho Paul and Odisho Linda
Create a Home Valuation Report for This Property
The Home Valuation Report is an in-depth analysis detailing your home's value as well as a comparison with similar homes in the area
Home Values in the Area
Average Home Value in this Area
Purchase History
| Date | Buyer | Sale Price | Title Company |
|---|---|---|---|
| Tapia Jesus | $69,000 | -- | |
| Koshaba Wahid | $41,333 | Attorneys Natl Title Network | |
| Odisho Paul | $56,000 | Attorneys Natl Title Network |
Source: Public Records
Mortgage History
| Date | Status | Borrower | Loan Amount |
|---|---|---|---|
| Open | Tapia Jesus | $62,100 | |
| Previous Owner | Koshaba Wahid | $49,360 |
Source: Public Records
Tax History Compared to Growth
Tax History
| Year | Tax Paid | Tax Assessment Tax Assessment Total Assessment is a certain percentage of the fair market value that is determined by local assessors to be the total taxable value of land and additions on the property. | Land | Improvement |
|---|---|---|---|---|
| 2024 | $2,110 | $12,150 | $2,078 | $10,072 |
| 2023 | $2,057 | $10,001 | $1,663 | $8,338 |
| 2022 | $2,057 | $10,001 | $1,663 | $8,338 |
| 2021 | $2,011 | $9,999 | $1,662 | $8,337 |
| 2020 | $1,118 | $5,020 | $1,570 | $3,450 |
| 2019 | $1,119 | $5,569 | $1,570 | $3,999 |
| 2018 | $1,100 | $5,569 | $1,570 | $3,999 |
| 2017 | $1,118 | $5,192 | $1,385 | $3,807 |
| 2016 | $1,040 | $5,192 | $1,385 | $3,807 |
| 2015 | $951 | $5,192 | $1,385 | $3,807 |
| 2014 | $1,271 | $6,849 | $1,246 | $5,603 |
| 2013 | $1,246 | $6,849 | $1,246 | $5,603 |
Source: Public Records
Map
Nearby Homes
- 2130 W Farwell Ave
- 2245 W Farwell Ave Unit 3B
- 2217 W Farwell Ave Unit 2B
- 2217 W Farwell Ave Unit 3B
- 2241 W Farwell Ave Unit 2D
- 2243 W Farwell Ave Unit 3D
- 6827 N Oakley Ave Unit 3C
- 6961 N Oakley Ave Unit 210
- 2065 W Farwell Ave Unit 20653N
- 2300 W Farwell Ave Unit 2
- 6957 N Hamilton Ave
- 2322 W Farwell Ave Unit 1W
- 2036 W Morse Ave Unit D
- 2325 W Farwell Ave Unit 2S
- 2101 W Greenleaf Ave
- 6959 N Ridge Blvd Unit 1C
- 2416 W Morse Ave
- 7019 N Ridge Blvd Unit 3B
- 7019 N Ridge Blvd Unit 3A
- 1958 W Morse Ave Unit B
- 2211 W Morse Ave Unit 3
- 2211 W Morse Ave Unit 22113
- 2211 W Morse Ave Unit 22111
- 2211 W Morse Ave Unit 1
- 2209 W Morse Ave Unit 22093
- 2209 W Morse Ave Unit 22092
- 2209 W Morse Ave Unit 22091
- 2209 W Morse Ave Unit 1
- 2207 W Morse Ave Unit 22071
- 2207 W Morse Ave Unit 22073
- 2207 W Morse Ave Unit 22072
- 2207 W Morse Ave Unit 1
- 2207 W Morse Ave Unit 2
- 2205 W Morse Ave Unit 2E
- 2201 W Morse Ave Unit 22011
- 2205 W Morse Ave Unit 22052
- 2205 W Morse Ave Unit 22051
- 2201 W Morse Ave Unit 22013
- 2203 W Morse Ave Unit 22033
- 2201 W Morse Ave Unit 22012