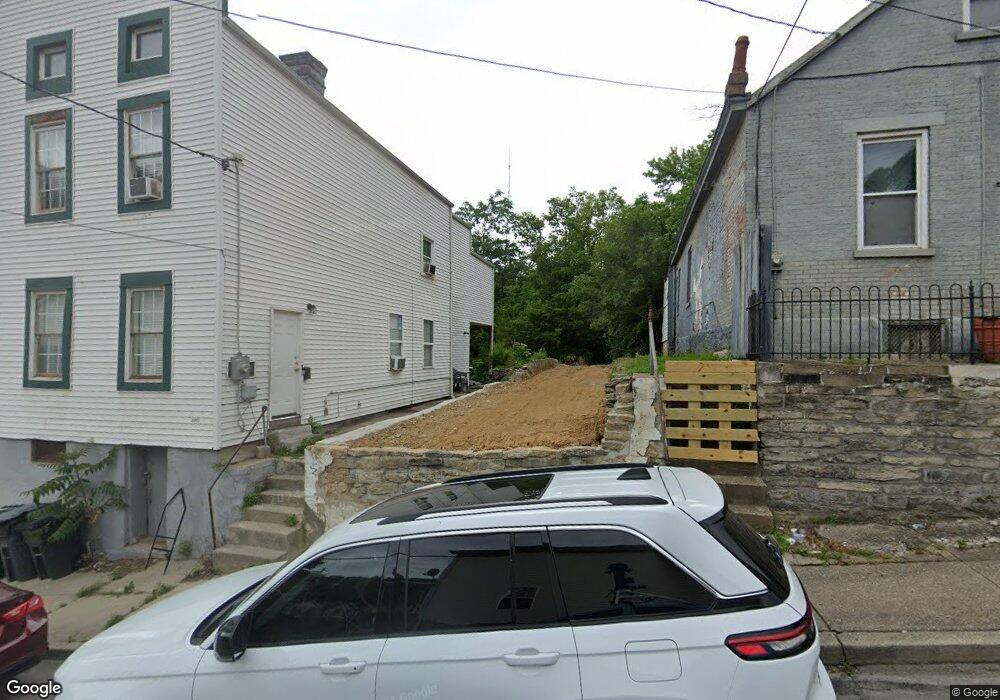
2213 Rice St Cincinnati, OH 45219
Mount Auburn NeighborhoodEstimated Value: $109,000 - $392,000
2
Beds
1
Bath
1,514
Sq Ft
$135/Sq Ft
Est. Value
About This Home
This home is located at 2213 Rice St, Cincinnati, OH 45219 and is currently estimated at $204,333, approximately $134 per square foot. 2213 Rice St is a home located in Hamilton County with nearby schools including Rothenberg Preparatory Academy, Robert A. Taft Information Technology High School, and Gilbert A. Dater High School.
Ownership History
Date
Name
Owned For
Owner Type
Purchase Details
Closed on
Mar 9, 2020
Sold by
Hamilton County Land Reutilization Corp
Bought by
M & K Property Investment Llc
Current Estimated Value
Purchase Details
Closed on
May 16, 2019
Sold by
County Of Hamilton
Bought by
Hamilton County Land Reutilization Corp
Purchase Details
Closed on
Oct 23, 2012
Sold by
Clayton Gregory
Bought by
Black Jerry
Create a Home Valuation Report for This Property
The Home Valuation Report is an in-depth analysis detailing your home's value as well as a comparison with similar homes in the area
Home Values in the Area
Average Home Value in this Area
Purchase History
| Date | Buyer | Sale Price | Title Company |
|---|---|---|---|
| M & K Property Investment Llc | -- | None Available | |
| Hamilton County Land Reutilization Corp | -- | None Available | |
| Black Jerry | $1,000 | None Available |
Source: Public Records
Tax History
| Year | Tax Paid | Tax Assessment Tax Assessment Total Assessment is a certain percentage of the fair market value that is determined by local assessors to be the total taxable value of land and additions on the property. | Land | Improvement |
|---|---|---|---|---|
| 2025 | $433 | $6,608 | $6,608 | -- |
| 2024 | $432 | $6,608 | $6,608 | -- |
| 2023 | $433 | $6,608 | $6,608 | $0 |
| 2022 | $130 | $1,652 | $1,652 | $0 |
| 2021 | $124 | $1,652 | $1,652 | $0 |
| 2020 | $10 | $1,652 | $1,652 | $0 |
| 2019 | $5,482 | $1,652 | $1,652 | $0 |
| 2018 | $6,025 | $1,652 | $1,652 | $0 |
| 2017 | $6,437 | $1,652 | $1,652 | $0 |
| 2016 | $6,845 | $6,979 | $1,477 | $5,502 |
| 2015 | $479 | $6,979 | $1,477 | $5,502 |
| 2014 | $552 | $8,029 | $1,477 | $6,552 |
| 2013 | $3,017 | $7,365 | $1,355 | $6,010 |
Source: Public Records
Map
Nearby Homes
- 114 Winkler St
- 132 Winkler St
- 2221 Rice St
- 2149 Rice St
- 2116 Loth St
- 40 Mulberry St
- 2241 Loth St
- 2266 Loth St
- 29 Mulberry St
- 2 Mulberry St
- 1 Mulberry St
- 136 Dorchester Ave
- 15 Mulberry St
- 138 Dorsey St
- 127 Valencia St
- 61 Peete St
- 36 E Clifton Ave
- 112 Valencia St
- 0 Goethe St Unit 1848287
- 152 Dorchester Ave
Your Personal Tour Guide
Ask me questions while you tour the home.