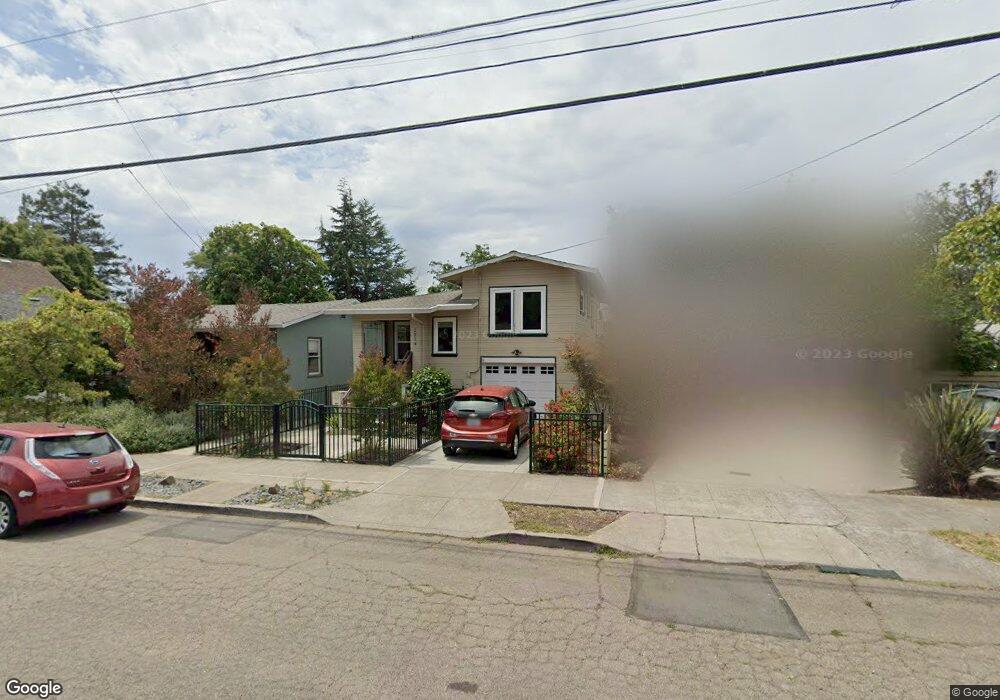
2214 Curtis St Berkeley, CA 94702
West Berkeley NeighborhoodEstimated Value: $1,235,739 - $1,518,000
2
Beds
2
Baths
1,076
Sq Ft
$1,286/Sq Ft
Est. Value
About This Home
This home is located at 2214 Curtis St, Berkeley, CA 94702 and is currently estimated at $1,383,685, approximately $1,285 per square foot. 2214 Curtis St is a home located in Alameda County with nearby schools including Rosa Parks Elementary School, Ruth Acty Elementary, and Berkeley Arts Magnet at Whittier School.
Ownership History
Date
Name
Owned For
Owner Type
Purchase Details
Closed on
Mar 29, 2016
Sold by
True Linda
Bought by
Karr Linda J and Linda J Karr Revocable Living
Current Estimated Value
Purchase Details
Closed on
Apr 10, 2015
Sold by
Mashinchi Manouchehr and Abbaszadeh Malileh
Bought by
Karr Linda
Home Financials for this Owner
Home Financials are based on the most recent Mortgage that was taken out on this home.
Original Mortgage
$300,000
Interest Rate
3.7%
Mortgage Type
Purchase Money Mortgage
Purchase Details
Closed on
Jul 29, 2014
Sold by
Kittel Peter and Kittel Mary Ellen
Bought by
Mashinchi Manouchehr and Abbaszadeh Maliheh
Purchase Details
Closed on
May 22, 2014
Sold by
Kittel Mary Ellen
Bought by
Kittel Peter and Kittel Mary Ellen
Purchase Details
Closed on
Oct 8, 2013
Sold by
Murchio George W
Bought by
Murchio George W and George W Murchio Trust
Create a Home Valuation Report for This Property
The Home Valuation Report is an in-depth analysis detailing your home's value as well as a comparison with similar homes in the area
Home Values in the Area
Average Home Value in this Area
Purchase History
| Date | Buyer | Sale Price | Title Company |
|---|---|---|---|
| Karr Linda J | -- | None Available | |
| Karr Linda | $910,000 | Old Republic Title Company | |
| Mashinchi Manouchehr | $595,000 | Chicago Title Company | |
| Kittel Peter | -- | None Available | |
| Kittel Mary Ellen | -- | None Available | |
| Murchio George W | -- | None Available |
Source: Public Records
Mortgage History
| Date | Status | Borrower | Loan Amount |
|---|---|---|---|
| Previous Owner | Karr Linda | $300,000 |
Source: Public Records
Tax History
| Year | Tax Paid | Tax Assessment Tax Assessment Total Assessment is a certain percentage of the fair market value that is determined by local assessors to be the total taxable value of land and additions on the property. | Land | Improvement |
|---|---|---|---|---|
| 2025 | $15,517 | $1,086,646 | $328,094 | $765,552 |
| 2024 | $15,517 | $1,065,207 | $321,662 | $750,545 |
| 2023 | $15,150 | $1,051,185 | $315,355 | $735,830 |
| 2022 | $14,853 | $1,023,574 | $309,172 | $721,402 |
| 2021 | $14,912 | $1,003,372 | $303,111 | $707,261 |
| 2020 | $14,236 | $1,000,017 | $300,005 | $700,012 |
| 2019 | $13,803 | $980,415 | $294,124 | $686,291 |
| 2018 | $13,589 | $961,195 | $288,358 | $672,837 |
| 2017 | $13,120 | $942,350 | $282,705 | $659,645 |
| 2016 | $12,777 | $923,877 | $277,163 | $646,714 |
| 2015 | $8,856 | $595,000 | $178,500 | $416,500 |
| 2014 | -- | $60,876 | $38,825 | $22,051 |
Source: Public Records
Map
Nearby Homes
- 2231 Byron St
- 2144 Curtis St
- 2324 Browning St
- 2327 10th St Unit 4
- 2241 Ninth St
- 1039 Channing Way
- 1919 Curtis St
- 2013 9th St
- 931 Bancroft Way
- 1142 Dwight Way
- 1118 Dwight Way
- 1261 Hearst Ave
- 1050 Allston Way
- 1092 Dwight Way
- 2220 7th St
- 2238 7th St
- 1128 Delaware St
- 2350 Sacramento St
- 1728 Curtis St
- 940 Delaware St
- 2216 Curtis St
- 2210 Curtis St Unit A
- 2210 Curtis St
- 2218 Curtis St
- 2208 Curtis St
- 2220 Curtis St
- 2215 Byron St
- 2219 Byron St
- 2206 Curtis St
- 2221 Byron St
- 2222 Curtis St
- 2211 Byron St
- 1138 Allston Way
- 1134 Allston Way
- 2215 Curtis St
- 1142 Allston Way
- 2219 Curtis St
- 2211 Curtis St
- 2226 Curtis St
- 2225 Byron St
Your Personal Tour Guide
Ask me questions while you tour the home.