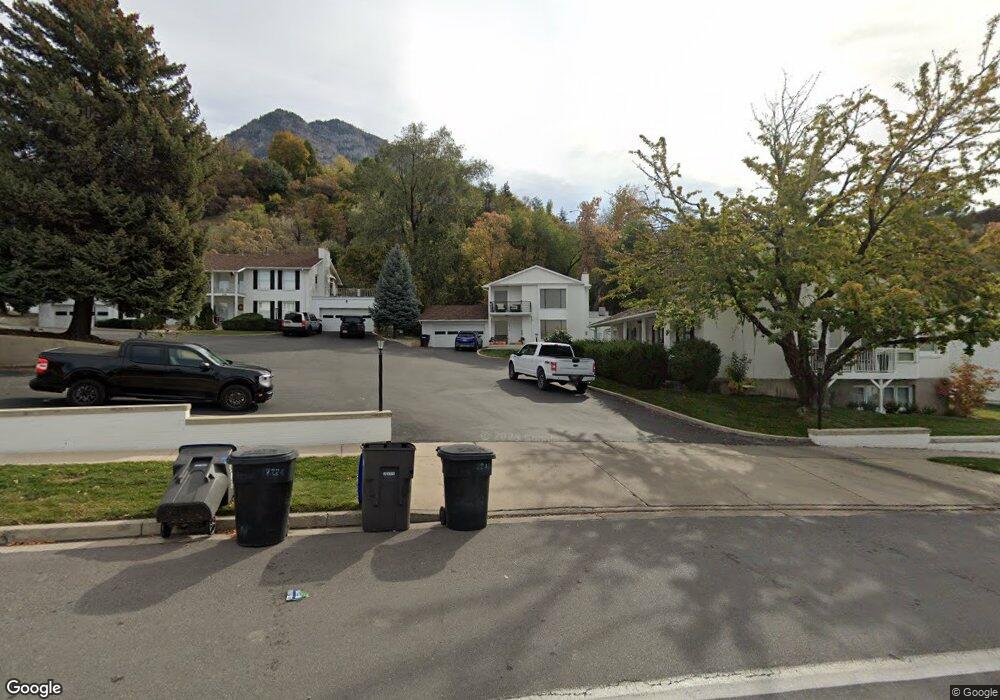
2214 Temple View Dr Provo, UT 84604
Rock Canyon NeighborhoodEstimated Value: $712,000 - $797,294
4
Beds
3
Baths
1,986
Sq Ft
$376/Sq Ft
Est. Value
About This Home
This home is located at 2214 Temple View Dr, Provo, UT 84604 and is currently estimated at $747,098, approximately $376 per square foot. 2214 Temple View Dr is a home located in Utah County with nearby schools including Wasatch Elementary School, Centennial Middle School, and Timpview High School.
Ownership History
Date
Name
Owned For
Owner Type
Purchase Details
Closed on
Jan 3, 2022
Sold by
Mckinney Kermit E and Mckinney Lisa M
Bought by
Daley Marcus Isaac and Daley Sandra
Current Estimated Value
Purchase Details
Closed on
Jan 28, 2020
Sold by
Cppd Investments Llc
Bought by
Mckinney Kermit E and Mckinney Lisa M
Home Financials for this Owner
Home Financials are based on the most recent Mortgage that was taken out on this home.
Original Mortgage
$259,462
Interest Rate
5.5%
Mortgage Type
FHA
Purchase Details
Closed on
Aug 21, 2019
Sold by
Nielsen Clark H and Harding Paula N
Bought by
Cppd Investment Lc
Purchase Details
Closed on
Aug 20, 2019
Sold by
Nielsen Clark H and Diane Rice Residence Trust
Bought by
Nielsen Clark H and Harding Paula N
Purchase Details
Closed on
Jun 26, 2018
Sold by
Rice Ralph and R U Co Trust
Bought by
Nielsen Clark H and The Diane Rice Residence Trust
Purchase Details
Closed on
Aug 26, 2002
Sold by
Nielsen Diane H and Neilsen Diane Hansen
Bought by
Rice Ralph and Rice Diane
Create a Home Valuation Report for This Property
The Home Valuation Report is an in-depth analysis detailing your home's value as well as a comparison with similar homes in the area
Home Values in the Area
Average Home Value in this Area
Purchase History
| Date | Buyer | Sale Price | Title Company |
|---|---|---|---|
| Daley Marcus Isaac | -- | First American Title | |
| Mckinney Kermit E | -- | Access Title Company | |
| Cppd Investment Lc | -- | None Available | |
| Nielsen Clark H | -- | None Available | |
| Nielsen Clark H | -- | None Available | |
| Rice Ralph | -- | -- |
Source: Public Records
Mortgage History
| Date | Status | Borrower | Loan Amount |
|---|---|---|---|
| Previous Owner | Mckinney Kermit E | $259,462 |
Source: Public Records
Tax History
| Year | Tax Paid | Tax Assessment Tax Assessment Total Assessment is a certain percentage of the fair market value that is determined by local assessors to be the total taxable value of land and additions on the property. | Land | Improvement |
|---|---|---|---|---|
| 2025 | $3,559 | $326,535 | -- | -- |
| 2024 | $3,559 | $350,350 | $0 | $0 |
| 2023 | $3,491 | $338,745 | $0 | $0 |
| 2022 | $2,869 | $280,720 | $0 | $0 |
| 2021 | $2,283 | $389,600 | $110,000 | $279,600 |
| 2020 | $2,276 | $364,100 | $110,000 | $254,100 |
| 2019 | $2,152 | $358,000 | $110,000 | $248,000 |
| 2018 | $2,000 | $337,400 | $110,000 | $227,400 |
| 2017 | $2,150 | $199,320 | $0 | $0 |
| 2016 | $2,255 | $194,920 | $0 | $0 |
| 2015 | $1,889 | $165,000 | $0 | $0 |
| 2014 | $1,812 | $165,000 | $0 | $0 |
Source: Public Records
Map
Nearby Homes
- 1108 E 2620 N
- 788 E 2680 N
- 2848 Foothill Dr
- 2254 N 390 E
- 1411 N Locust Ln
- 1840 Sego Ln
- 758 E 3030 N
- 3129 Cherokee Ln
- 990 Cedar Ave
- 240 E 2230 N Unit 7
- 360 Sumac Ln
- 2774 N 370 E
- 186 E 2100 N
- 182 E 2090 N
- 3250 Mohawk Ln
- 1205 N Old Willow Ln
- 3411 N Piute Dr
- 1040 N Oakmont Ln
- 2735 N Country Club Dr
- 3442 Navajo Ln
- 2214 Temple View Dr Unit 10
- 2218 Temple View Dr
- 2208 Temple View Dr
- 2224 Temple View Dr
- 2202 Temple View Dr
- 2195 N 1220 E
- 2244 Temple View Dr
- 2246 Temple View Dr
- 2238 Temple View Dr
- 2176 Temple View Dr
- 1226 E 2300 N
- 2274 Temple View Dr
- 2181 N 1220 E
- 1228 E 2300 N
- 2276 Temple View Dr
- 1242 E 2300 N
- 2150 Oak Ln
- 2165 Oak Ln
- 1244 E 2300 N
- 1249 Oakcrest Cir
Your Personal Tour Guide
Ask me questions while you tour the home.