Estimated Value: $942,964 - $1,341,000
5
Beds
3
Baths
3,339
Sq Ft
$340/Sq Ft
Est. Value
About This Home
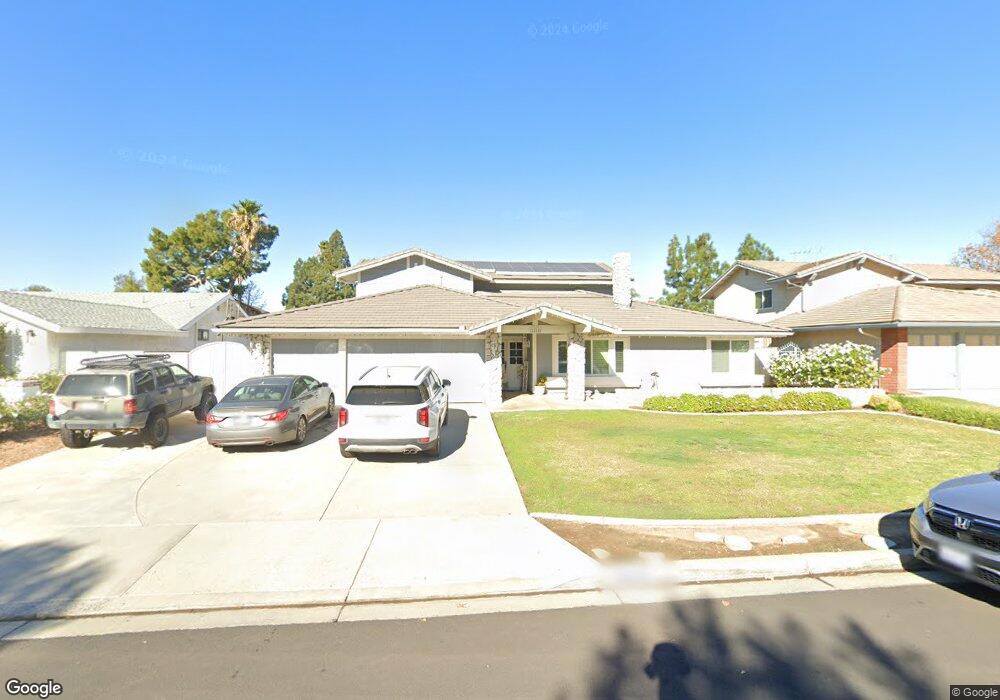
This home is located at 2215 Canyon Ridge Cir, Norco, CA 92860 and is currently estimated at $1,133,991, approximately $339 per square foot. 2215 Canyon Ridge Cir is a home located in Riverside County with nearby schools including Highland Elementary, Norco Intermediate School, and Norco High School.
Ownership History
Date
Name
Owned For
Owner Type
Purchase Details
Closed on
Aug 7, 2023
Sold by
Donovan Lee and Donovan Susan
Bought by
Family Trust and Donovan
Current Estimated Value
Purchase Details
Closed on
Apr 24, 1997
Sold by
Bertsche William C and Bertsche Heidi
Bought by
Donovan Lee and Donovan Susan
Home Financials for this Owner
Home Financials are based on the most recent Mortgage that was taken out on this home.
Original Mortgage
$214,600
Interest Rate
6%
Purchase Details
Closed on
Oct 21, 1994
Sold by
Mcnabb Kavin K and Mcnabb Nita C
Bought by
Ford Consumer Finance Company Inc
Purchase Details
Closed on
Jan 12, 1994
Sold by
Ford Consumer Finance Company Inc
Bought by
Bertsche William C and Bertsche Heidi
Home Financials for this Owner
Home Financials are based on the most recent Mortgage that was taken out on this home.
Original Mortgage
$204,020
Interest Rate
7.95%
Mortgage Type
Seller Take Back
Create a Home Valuation Report for This Property
The Home Valuation Report is an in-depth analysis detailing your home's value as well as a comparison with similar homes in the area
Home Values in the Area
Average Home Value in this Area
Purchase History
| Date | Buyer | Sale Price | Title Company |
|---|---|---|---|
| Family Trust | -- | None Listed On Document | |
| Donovan Lee | $226,000 | Northern Counties Title | |
| Ford Consumer Finance Company Inc | $152,000 | Northern Counties Title Ins | |
| Bertsche William C | -- | Chicago Title Company |
Source: Public Records
Mortgage History
| Date | Status | Borrower | Loan Amount |
|---|---|---|---|
| Previous Owner | Donovan Lee | $214,600 | |
| Previous Owner | Bertsche William C | $204,020 |
Source: Public Records
Tax History Compared to Growth
Tax History
| Year | Tax Paid | Tax Assessment Tax Assessment Total Assessment is a certain percentage of the fair market value that is determined by local assessors to be the total taxable value of land and additions on the property. | Land | Improvement |
|---|---|---|---|---|
| 2025 | $3,950 | $368,050 | $105,847 | $262,203 |
| 2023 | $3,950 | $353,760 | $101,738 | $252,022 |
| 2022 | $3,822 | $346,825 | $99,744 | $247,081 |
| 2021 | $3,744 | $340,026 | $97,789 | $242,237 |
| 2020 | $3,702 | $336,541 | $96,787 | $239,754 |
| 2019 | $3,615 | $329,943 | $94,890 | $235,053 |
| 2018 | $3,530 | $323,475 | $93,031 | $230,444 |
| 2017 | $3,441 | $317,133 | $91,207 | $225,926 |
| 2016 | $3,405 | $310,916 | $89,419 | $221,497 |
| 2015 | $3,329 | $306,248 | $88,077 | $218,171 |
| 2014 | $3,204 | $300,251 | $86,352 | $213,899 |
Source: Public Records
Map
Nearby Homes
- 4168 Cedar Ave
- 3985 Oakridge Cir
- 4072 Acacia Ave
- 0 Norco Dr
- 3711 Alhambra St
- 7618 Hertz Place
- 4292 Woodward Ave
- 3496 Hamner Ave
- 3480 Hamner Ave
- 13288 Cactus Flower St
- 13262 Los Robles Ct
- 12787 Clemson Dr
- 7313 Bay Bridge Rd
- 13580 Brush Creek Ct
- 12782 Lomond Way
- 12786 Lomond Way
- 4072 Corona Ave
- 0 6th & Corona Unit SW25164144
- 1100 6th St
- 7269 Canopy Ln
- 2235 Canyon Ridge Cir
- 2201 Canyon Ridge Cir
- 2230 Cedar Ridge Dr
- 2210 Cedar Ridge Dr
- 2253 Canyon Ridge Cir
- 2240 Cedar Ridge Dr
- 2222 Canyon Ridge Cir
- 2246 Canyon Ridge Cir
- 2202 Canyon Ridge Cir
- 2271 Canyon Ridge Cir
- 2268 Canyon Ridge Cir
- 4245 River Ridge Dr
- 4233 River Ridge Dr
- 2250 Cedar Ridge Dr
- 4257 River Ridge Dr
- 4221 River Ridge Dr
- 4269 River Ridge Dr
- 2280 Canyon Ridge Cir
- 2233 Vista Ridge Cir
- 2305 Canyon Ridge Cir