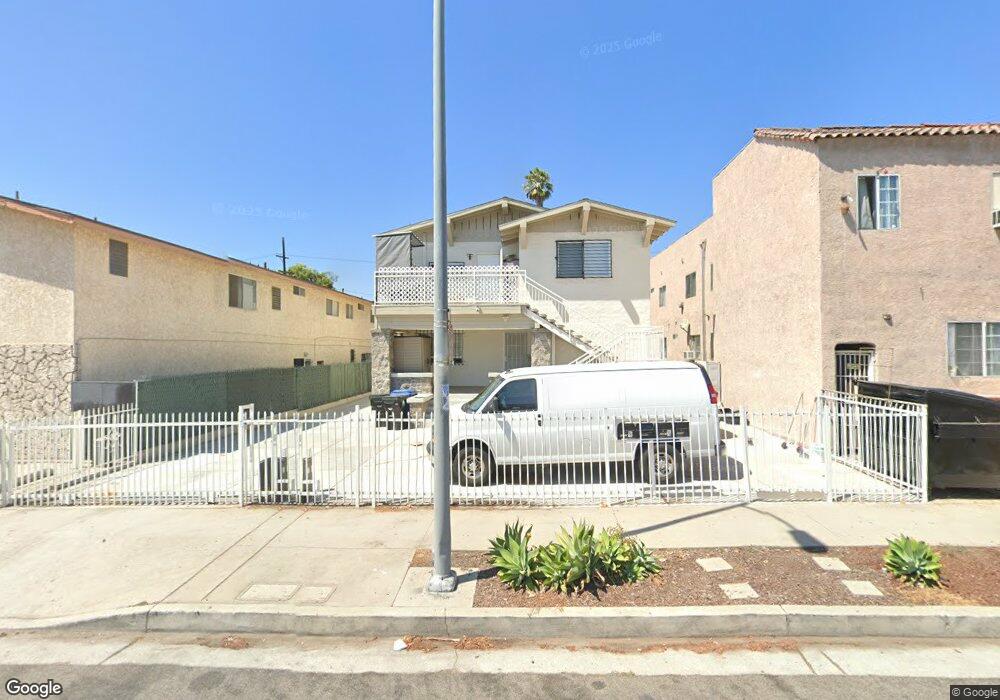
2215 Crenshaw Blvd Los Angeles, CA 90016
Mid-City NeighborhoodEstimated Value: $1,231,000 - $2,120,422
4
Beds
2
Baths
2,741
Sq Ft
$603/Sq Ft
Est. Value
About This Home
This home is located at 2215 Crenshaw Blvd, Los Angeles, CA 90016 and is currently estimated at $1,653,356, approximately $603 per square foot. 2215 Crenshaw Blvd is a home located in Los Angeles County with nearby schools including Arlington Heights Elementary School, Johnnie L. Cochran Jr. Middle School, and Los Angeles Senior High School.
Ownership History
Date
Name
Owned For
Owner Type
Purchase Details
Closed on
Apr 18, 2016
Sold by
Chang Ji C
Bought by
Park Joon Woo and Park In Hwa
Current Estimated Value
Home Financials for this Owner
Home Financials are based on the most recent Mortgage that was taken out on this home.
Original Mortgage
$562,000
Outstanding Balance
$443,931
Interest Rate
3.59%
Mortgage Type
New Conventional
Estimated Equity
$1,209,425
Purchase Details
Closed on
Feb 16, 2011
Sold by
Hu Moon Young
Bought by
Chang Ji C
Purchase Details
Closed on
Jan 25, 2011
Sold by
Bv Housing Partners Llc
Bought by
Chang Ji C
Purchase Details
Closed on
Apr 8, 2010
Sold by
Small Joyce
Bought by
Bv Housing Partners
Create a Home Valuation Report for This Property
The Home Valuation Report is an in-depth analysis detailing your home's value as well as a comparison with similar homes in the area
Home Values in the Area
Average Home Value in this Area
Purchase History
| Date | Buyer | Sale Price | Title Company |
|---|---|---|---|
| Park Joon Woo | $835,000 | None Available | |
| Chang Ji C | -- | First American Title Company | |
| Chang Ji C | $387,000 | Fatcola-Resale | |
| Bv Housing Partners | $320,000 | Accommodation |
Source: Public Records
Mortgage History
| Date | Status | Borrower | Loan Amount |
|---|---|---|---|
| Open | Park Joon Woo | $562,000 |
Source: Public Records
Tax History Compared to Growth
Tax History
| Year | Tax Paid | Tax Assessment Tax Assessment Total Assessment is a certain percentage of the fair market value that is determined by local assessors to be the total taxable value of land and additions on the property. | Land | Improvement |
|---|---|---|---|---|
| 2025 | $13,558 | $988,465 | $686,600 | $301,865 |
| 2024 | $13,558 | $969,085 | $673,138 | $295,947 |
| 2023 | $13,331 | $950,085 | $659,940 | $290,145 |
| 2022 | $12,768 | $931,456 | $647,000 | $284,456 |
| 2021 | $12,468 | $913,193 | $634,314 | $278,879 |
| 2020 | $12,559 | $903,830 | $627,810 | $276,020 |
| 2019 | $12,118 | $886,108 | $615,500 | $270,608 |
| 2018 | $11,921 | $868,734 | $603,432 | $265,302 |
| 2016 | $6,504 | $445,887 | $335,066 | $110,821 |
| 2015 | $6,425 | $439,190 | $330,033 | $109,157 |
| 2014 | $6,456 | $430,588 | $323,569 | $107,019 |
Source: Public Records
Map
Nearby Homes
- 2125 Crenshaw Blvd
- 2009 S Victoria Ave
- 2311 Crenshaw Blvd
- 2111 S Bronson Ave
- 1929 Crenshaw Blvd
- 1947 S Bronson Ave
- 2136 S Victoria Ave
- 2308 11th Ave
- 1931 Buckingham Rd
- 2516 13th Ave
- 2546 S Bronson Ave
- 2413 S Victoria Ave
- 1746 Crenshaw Blvd
- 1685 S Victoria Ave
- 2025 West Blvd
- 4512 St Elmo Dr
- 2011 8th Ave
- 4522 Saint Elmo Dr
- 2209 West Blvd
- 2102 Hillcrest Dr
- 2215 Crenshaw Blvd Unit 2
- 2215 Crenshaw Unit 2
- 2215 Crenshaw
- 2217 Crenshaw Blvd
- 2219 Crenshaw Blvd
- 2219 Crenshaw Blvd Unit 6
- 2209 Crenshaw Blvd
- 2205 Crenshaw Blvd
- 2223 Crenshaw Blvd
- 2205 Crenshaw Blvd
- 1956 S Victoria Ave
- 2129 Crenshaw Blvd Unit 3
- 2000 S Victoria Ave
- 1950 S Victoria Ave
- 1944 S Victoria Ave
- 2125 Crenshaw Blvd
- 2012 S Victoria Ave
- 2241 S Crenshaw Blvd
- 2241 Crenshaw Blvd
- 2241 S Crenshaw