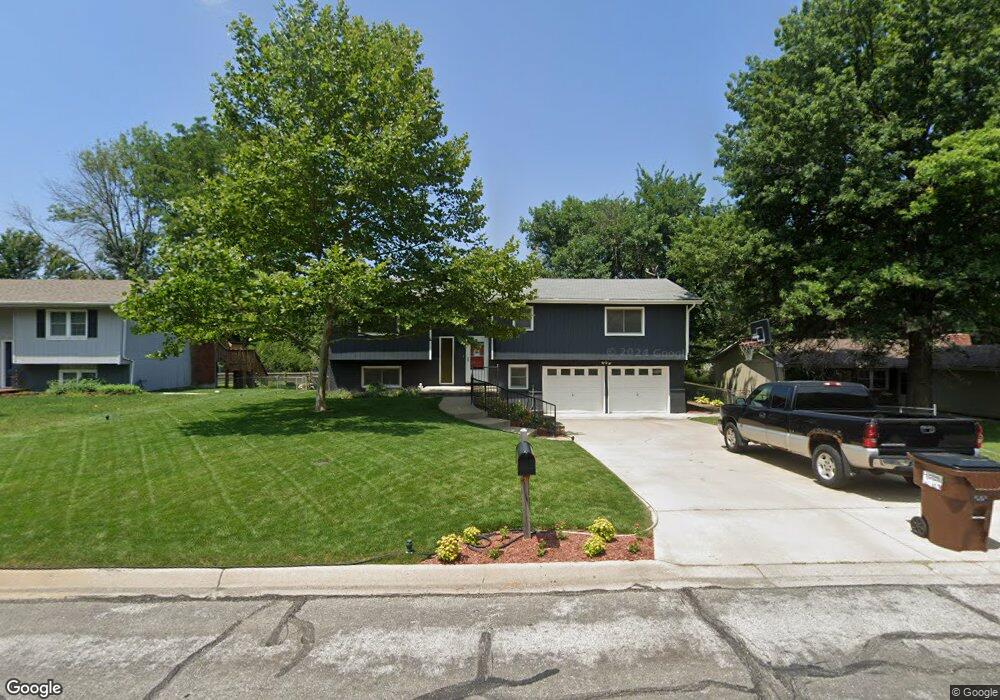
2215 Melholland Rd Lawrence, KS 66047
Estimated Value: $301,316 - $331,000
4
Beds
2
Baths
2,192
Sq Ft
$143/Sq Ft
Est. Value
About This Home
This home is located at 2215 Melholland Rd, Lawrence, KS 66047 and is currently estimated at $313,439, approximately $142 per square foot. 2215 Melholland Rd is a home located in Douglas County with nearby schools including Schwegler Elementary School, Billy Mills Middle School, and Lawrence High School.
Ownership History
Date
Name
Owned For
Owner Type
Purchase Details
Closed on
Jun 8, 2017
Sold by
Robinson Travis M and Robinson Melissa R
Bought by
Farmer Jordan L and Farmer Denise M
Current Estimated Value
Home Financials for this Owner
Home Financials are based on the most recent Mortgage that was taken out on this home.
Original Mortgage
$179,550
Outstanding Balance
$149,061
Interest Rate
3.95%
Mortgage Type
New Conventional
Estimated Equity
$164,378
Purchase Details
Closed on
Feb 7, 2013
Sold by
Bellassai John C and Bellassai Erin R
Bought by
Robinson Travis M and Robinson Melissa R
Home Financials for this Owner
Home Financials are based on the most recent Mortgage that was taken out on this home.
Original Mortgage
$152,100
Interest Rate
3.43%
Mortgage Type
New Conventional
Purchase Details
Closed on
Jul 12, 2010
Sold by
Shupert Martin K and Shupert Rebecca J
Bought by
Bellassai John C and Bellassai Erin R
Home Financials for this Owner
Home Financials are based on the most recent Mortgage that was taken out on this home.
Original Mortgage
$151,841
Interest Rate
4.54%
Mortgage Type
FHA
Create a Home Valuation Report for This Property
The Home Valuation Report is an in-depth analysis detailing your home's value as well as a comparison with similar homes in the area
Home Values in the Area
Average Home Value in this Area
Purchase History
| Date | Buyer | Sale Price | Title Company |
|---|---|---|---|
| Farmer Jordan L | -- | Security 1St Title | |
| Robinson Travis M | -- | Continental Title Company | |
| Bellassai John C | -- | Continental Title Company |
Source: Public Records
Mortgage History
| Date | Status | Borrower | Loan Amount |
|---|---|---|---|
| Open | Farmer Jordan L | $179,550 | |
| Previous Owner | Robinson Travis M | $152,100 | |
| Previous Owner | Bellassai John C | $151,841 |
Source: Public Records
Tax History Compared to Growth
Tax History
| Year | Tax Paid | Tax Assessment Tax Assessment Total Assessment is a certain percentage of the fair market value that is determined by local assessors to be the total taxable value of land and additions on the property. | Land | Improvement |
|---|---|---|---|---|
| 2025 | $4,327 | $35,087 | $7,475 | $27,612 |
| 2024 | $4,195 | $34,040 | $7,475 | $26,565 |
| 2023 | $4,082 | $31,867 | $5,520 | $26,347 |
| 2022 | $3,747 | $29,084 | $5,060 | $24,024 |
| 2021 | $3,448 | $25,870 | $4,830 | $21,040 |
| 2020 | $3,173 | $23,955 | $4,830 | $19,125 |
| 2019 | $2,872 | $21,735 | $4,830 | $16,905 |
| 2018 | $2,893 | $21,735 | $4,600 | $17,135 |
| 2017 | $2,648 | $19,700 | $4,600 | $15,100 |
| 2016 | $2,481 | $19,297 | $4,602 | $14,695 |
| 2015 | $2,476 | $19,251 | $4,602 | $14,649 |
| 2014 | $2,475 | $19,435 | $4,602 | $14,833 |
Source: Public Records
Map
Nearby Homes
- 3013 W 23rd Terrace
- 3018 Topeka Ln
- 2407 Yosemite Dr
- 2139 Quail Creek Dr
- 2415 Bryce Ct
- 1840 Quail Creek Dr
- 2709 Lawrence Ave
- 3700 Quail Creek Ct
- 2726 Chipperfield Rd
- 2728 Chipperfield Rd
- 3621 Brush Creek Dr
- 1704 W 20th St
- 1439 Applegate Ct
- 2901 University Dr
- 2901 University Dr Unit A, B, C, D, E, F
- 1633 W 20th St
- 2018 Crossgate Dr
- 1620 W 20th Terrace
- 1507 Medinah Cir
- 1908 Crossgate Dr
- 2209 Melholland Rd
- 2219 Melholland Rd
- 2200 Breckenridge Dr
- 2202 Breckenridge Dr
- 2205 Melholland Rd
- 2223 Melholland Rd
- 2204 Breckenridge Dr
- 2201 Melholland Rd
- 2145 Atchison Ave
- 2201 Vail Way
- 2206 Breckenridge Dr
- 2216 Melholland Rd
- 2208 Melholland Rd
- 2220 Melholland Rd
- 2200 Vail Way
- 2203 Vail Way
- 2227 Melholland Rd
- 2204 Melholland Rd
- 2141 Atchison Ave
- 2203 Breckenridge Dr