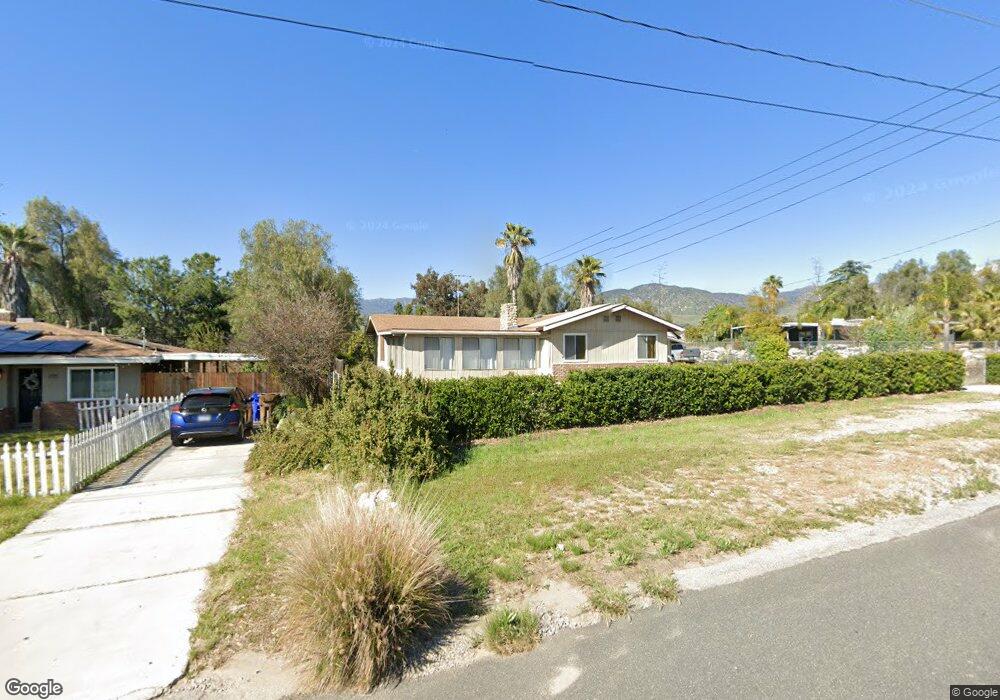
2215 Mentone Blvd Mentone, CA 92359
Estimated Value: $114,000 - $133,000
1
Bed
1
Bath
860
Sq Ft
$144/Sq Ft
Est. Value
About This Home
This home is located at 2215 Mentone Blvd, Mentone, CA 92359 and is currently estimated at $123,500, approximately $143 per square foot. 2215 Mentone Blvd is a home located in San Bernardino County with nearby schools including Mentone Elementary School, Moore Middle School, and Redlands East Valley High School.
Ownership History
Date
Name
Owned For
Owner Type
Purchase Details
Closed on
Jun 5, 2020
Sold by
Bise James C and Bise Kristie L
Bought by
Bise James C and Bise Kristie L
Current Estimated Value
Purchase Details
Closed on
Aug 22, 2007
Sold by
Fuller Shirley
Bought by
Fuller Samuel B
Purchase Details
Closed on
Aug 15, 2007
Sold by
Fuller Samuel B
Bought by
Bise James C and Bise Kristie L
Purchase Details
Closed on
Jul 10, 1998
Sold by
Schrack Austin E
Bought by
Januscheski William H and Fuller Samuel B
Home Financials for this Owner
Home Financials are based on the most recent Mortgage that was taken out on this home.
Original Mortgage
$17,000
Interest Rate
6.93%
Mortgage Type
Seller Take Back
Purchase Details
Closed on
Feb 18, 1998
Sold by
Lewis C Jeremy
Bought by
Schrack Austin E and Stephenson Frances M
Create a Home Valuation Report for This Property
The Home Valuation Report is an in-depth analysis detailing your home's value as well as a comparison with similar homes in the area
Home Values in the Area
Average Home Value in this Area
Purchase History
| Date | Buyer | Sale Price | Title Company |
|---|---|---|---|
| Bise James C | -- | None Available | |
| Fuller Samuel B | -- | Old Republic Title Company | |
| Bise James C | $65,000 | Old Republic Title Company | |
| Cuddy Roland W | -- | Old Republic Title Company | |
| Januscheski William H | $27,000 | -- | |
| Schrack Austin E | $16,000 | -- |
Source: Public Records
Mortgage History
| Date | Status | Borrower | Loan Amount |
|---|---|---|---|
| Previous Owner | Januscheski William H | $17,000 |
Source: Public Records
Tax History
| Year | Tax Paid | Tax Assessment Tax Assessment Total Assessment is a certain percentage of the fair market value that is determined by local assessors to be the total taxable value of land and additions on the property. | Land | Improvement |
|---|---|---|---|---|
| 2025 | $1,043 | $85,380 | $31,524 | $53,856 |
| 2024 | $1,022 | $83,706 | $30,906 | $52,800 |
| 2023 | $1,000 | $82,065 | $30,300 | $51,765 |
| 2022 | $979 | $80,456 | $29,706 | $50,750 |
| 2021 | $958 | $78,879 | $29,124 | $49,755 |
| 2020 | $951 | $78,070 | $28,825 | $49,245 |
| 2019 | $937 | $76,539 | $28,260 | $48,279 |
| 2018 | $761 | $75,038 | $27,706 | $47,332 |
| 2017 | $752 | $73,567 | $27,163 | $46,404 |
| 2016 | $734 | $72,124 | $26,630 | $45,494 |
| 2015 | $720 | $71,041 | $26,230 | $44,811 |
| 2014 | $702 | $69,649 | $25,716 | $43,933 |
Source: Public Records
Map
Nearby Homes
- 1246 Venice Ave
- 1212 Venice Ave
- 2140 Mentone Blvd Unit 43
- 2168 Stonewood St
- 1255 Amethyst St Unit 49
- 1255 Amethyst Ave Unit 21
- 1255 Amethyst Ave Unit 24
- 1255 Amethyst Ave Unit 18
- 0 Mentone Blvd
- 1176 Woodbury Ln
- 1365 Crafton Ave Unit 1089
- 1365 Crafton Ave Unit 2101
- 31271 Moss St
- 2058 Anzio Ave
- 31110 Nice Ave
- 1373 Agate Ave
- 2456 Mill Creek Rd
- 31025 Quarry St
- 1337 Beryl Ave
- 1232 Turquoise Ave
- 2215 Mentone Blvd
- 2211 Mentone Blvd
- 2207 Mentone Blvd
- 1314 Sapphire Ave
- 2216 Mentone Blvd
- 2203 Mentone Blvd
- 2218 Mentone Blvd
- 10080 Salic St
- 10050 Salic St
- 2222 Mentone Blvd
- 1297 Venice Ave
- 2191 Mentone Blvd
- 1309 Sapphire Ave
- 1293 Venice Ave
- 1319 Sapphire Ave
- 1286 Venice Ave
- 1321 Sapphire Ave
- 1330 Sapphire Ave
- 2214 Sapphire Ave
- 2226 Mentone Blvd
Your Personal Tour Guide
Ask me questions while you tour the home.