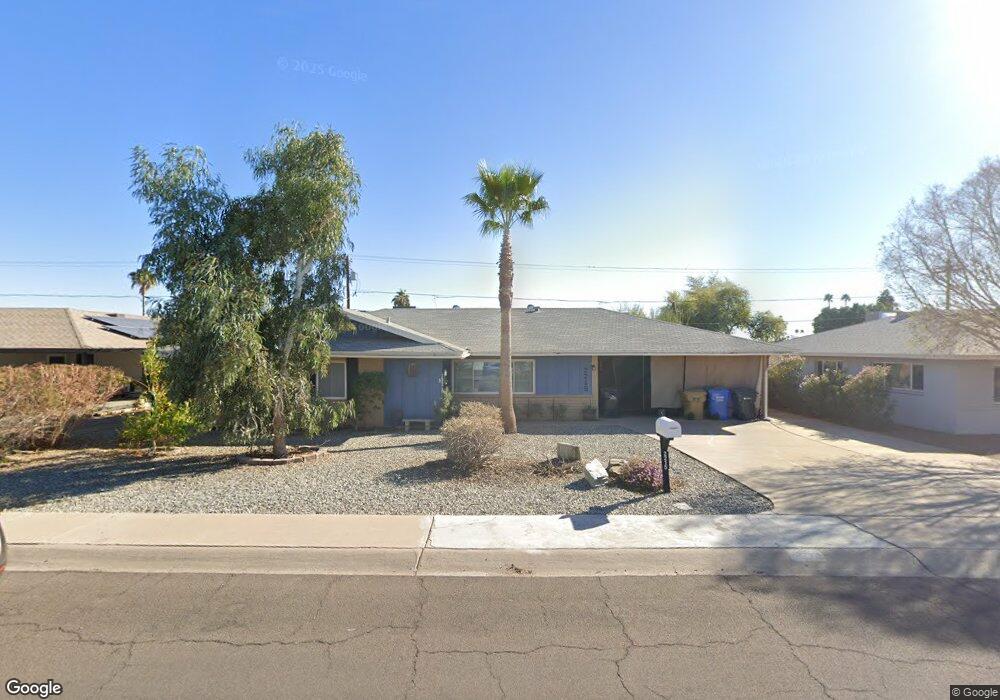
2215 W Anderson Ave Phoenix, AZ 85023
North Central Phoenix NeighborhoodEstimated Value: $314,745 - $477,000
3
Beds
2
Baths
2,184
Sq Ft
$186/Sq Ft
Est. Value
About This Home
This home is located at 2215 W Anderson Ave, Phoenix, AZ 85023 and is currently estimated at $405,686, approximately $185 per square foot. 2215 W Anderson Ave is a home located in Maricopa County with nearby schools including Village Meadows Elementary School, Deer Valley Middle School, and Barry Goldwater High School.
Ownership History
Date
Name
Owned For
Owner Type
Purchase Details
Closed on
Jul 1, 2009
Sold by
Lloyd Harold H
Bought by
Lucas Charles E
Current Estimated Value
Home Financials for this Owner
Home Financials are based on the most recent Mortgage that was taken out on this home.
Original Mortgage
$122,735
Outstanding Balance
$77,961
Interest Rate
4.79%
Mortgage Type
FHA
Estimated Equity
$327,725
Purchase Details
Closed on
Jan 31, 2002
Sold by
Homes For Life Inc
Bought by
Lloyd Harold H
Home Financials for this Owner
Home Financials are based on the most recent Mortgage that was taken out on this home.
Original Mortgage
$90,000
Interest Rate
6.94%
Mortgage Type
New Conventional
Purchase Details
Closed on
Apr 26, 2001
Sold by
Hanan Monty E and Inland Mtg Corp
Bought by
Capital Realty Services Llc
Create a Home Valuation Report for This Property
The Home Valuation Report is an in-depth analysis detailing your home's value as well as a comparison with similar homes in the area
Home Values in the Area
Average Home Value in this Area
Purchase History
| Date | Buyer | Sale Price | Title Company |
|---|---|---|---|
| Lucas Charles E | $125,000 | Security Title Agency | |
| Lloyd Harold H | $128,000 | Capital Title Agency Inc | |
| Homes For Life Inc | -- | Capital Title Agency Inc | |
| Capital Realty Services Llc | $101,900 | -- |
Source: Public Records
Mortgage History
| Date | Status | Borrower | Loan Amount |
|---|---|---|---|
| Open | Lucas Charles E | $122,735 | |
| Previous Owner | Lloyd Harold H | $90,000 |
Source: Public Records
Tax History Compared to Growth
Tax History
| Year | Tax Paid | Tax Assessment Tax Assessment Total Assessment is a certain percentage of the fair market value that is determined by local assessors to be the total taxable value of land and additions on the property. | Land | Improvement |
|---|---|---|---|---|
| 2025 | $1,232 | $14,318 | -- | -- |
| 2024 | $1,212 | $13,636 | -- | -- |
| 2023 | $1,212 | $30,880 | $6,170 | $24,710 |
| 2022 | $1,167 | $23,760 | $4,750 | $19,010 |
| 2021 | $1,218 | $21,400 | $4,280 | $17,120 |
| 2020 | $1,196 | $19,570 | $3,910 | $15,660 |
| 2019 | $1,159 | $17,870 | $3,570 | $14,300 |
| 2018 | $1,119 | $16,100 | $3,220 | $12,880 |
| 2017 | $1,081 | $14,160 | $2,830 | $11,330 |
| 2016 | $1,020 | $13,820 | $2,760 | $11,060 |
| 2015 | $910 | $12,770 | $2,550 | $10,220 |
Source: Public Records
Map
Nearby Homes
- 2336 W Village Dr
- 2317 W Hartford Ave
- 2331 W Hartford Ave
- 2418 W Greenbriar Dr
- 2437 W Village Dr
- 2509 W Village Dr
- 17830 N 24th Dr
- 2415 W Villa Rita Dr
- 18045 N 20th Ln
- 2216 W Villa Maria Dr
- 1916 W Morningside Dr Unit 113
- 1916 W Morningside Dr Unit 108
- 18046 N 20th Ave
- 18218 N 24th Ave
- 17855 N 27th Dr
- 17242 N 16th Dr Unit 6
- 2121 W Union Hills Dr Unit 113
- 2407 W Paradise Ln
- 2315 W Union Hills Dr Unit 119
- 2315 W Union Hills Dr Unit 115
- 2209 W Anderson Ave
- 2221 W Anderson Ave
- 2218 W Hartford Ave
- 2212 W Hartford Ave
- 2201 W Anderson Ave
- 2301 W Anderson Ave
- 2228 W Hartford Ave
- 2208 W Hartford Ave
- 2210 W Anderson Ave
- 2216 W Anderson Ave
- 2222 W Anderson Ave
- 2232 W Hartford Ave
- 2202 W Anderson Ave
- 2202 W Hartford Ave
- 2141 W Anderson Ave
- 2309 W Anderson Ave
- 2238 W Hartford Ave
- 2217 W Hartford Ave
- 2144 W Hartford Ave
- 2221 W Hartford Ave