2216 E 97th Ave Thornton, CO 80229
Quimby NeighborhoodEstimated Value: $422,000 - $458,000
3
Beds
1
Bath
1,046
Sq Ft
$420/Sq Ft
Est. Value
About This Home
This home is located at 2216 E 97th Ave, Thornton, CO 80229 and is currently estimated at $439,468, approximately $420 per square foot. 2216 E 97th Ave is a home located in Adams County with nearby schools including Trailside Academy.
Ownership History
Date
Name
Owned For
Owner Type
Purchase Details
Closed on
Dec 28, 2004
Sold by
Macy Dale L and Macy Denise J
Bought by
Barney Leslie and Barney Mary Jane
Current Estimated Value
Home Financials for this Owner
Home Financials are based on the most recent Mortgage that was taken out on this home.
Original Mortgage
$152,000
Outstanding Balance
$76,507
Interest Rate
6.12%
Mortgage Type
Unknown
Estimated Equity
$362,961
Purchase Details
Closed on
Nov 12, 2001
Sold by
Macy Dale L and Andrews Denise J
Bought by
Macy Dale L and Macy Denise J
Home Financials for this Owner
Home Financials are based on the most recent Mortgage that was taken out on this home.
Original Mortgage
$118,000
Interest Rate
6.54%
Purchase Details
Closed on
Aug 7, 1998
Sold by
Homes Llc
Bought by
Andrews Denise J and Macy Dale L
Home Financials for this Owner
Home Financials are based on the most recent Mortgage that was taken out on this home.
Original Mortgage
$117,543
Interest Rate
6.9%
Mortgage Type
FHA
Create a Home Valuation Report for This Property
The Home Valuation Report is an in-depth analysis detailing your home's value as well as a comparison with similar homes in the area
Home Values in the Area
Average Home Value in this Area
Purchase History
| Date | Buyer | Sale Price | Title Company |
|---|---|---|---|
| Barney Leslie | $190,000 | Title America | |
| Macy Dale L | -- | Stewart Title | |
| Andrews Denise J | $118,866 | -- |
Source: Public Records
Mortgage History
| Date | Status | Borrower | Loan Amount |
|---|---|---|---|
| Open | Barney Leslie | $152,000 | |
| Previous Owner | Macy Dale L | $118,000 | |
| Previous Owner | Andrews Denise J | $117,543 | |
| Closed | Barney Leslie | $38,000 |
Source: Public Records
Tax History
| Year | Tax Paid | Tax Assessment Tax Assessment Total Assessment is a certain percentage of the fair market value that is determined by local assessors to be the total taxable value of land and additions on the property. | Land | Improvement |
|---|---|---|---|---|
| 2025 | $2,547 | $29,040 | $7,480 | $21,560 |
| 2024 | $2,547 | $26,690 | $6,880 | $19,810 |
| 2023 | $2,526 | $30,780 | $6,020 | $24,760 |
| 2022 | $2,056 | $20,630 | $6,190 | $14,440 |
| 2021 | $1,940 | $20,630 | $6,190 | $14,440 |
| 2020 | $1,990 | $21,380 | $6,360 | $15,020 |
| 2019 | $2,001 | $21,380 | $6,360 | $15,020 |
| 2018 | $1,739 | $17,490 | $5,760 | $11,730 |
| 2017 | $1,704 | $17,490 | $5,760 | $11,730 |
| 2016 | $1,331 | $13,390 | $3,340 | $10,050 |
| 2015 | $1,164 | $13,390 | $3,340 | $10,050 |
| 2014 | $915 | $10,230 | $2,550 | $7,680 |
Source: Public Records
Map
Nearby Homes
- 2083 E 97th Place
- 9755 High St
- 1792 E 97th Ave
- 9827 Race St
- 1696 E 96th Way
- 2422 E 96th Way
- 1960 Rowena St
- 1838 E 98th Ave
- 2621 E 98th Ave
- 2244 E 101st Ave
- 2684 E 97th Ave
- 9718 Clayton Cir
- 9440 Russell Way
- 1920 Carrol Ct
- 1501 E 98th Ave
- 10099 Williams St
- 9320 High St
- 9340 Gail Ct
- 9410 Lilly Ct
- 9241 High St
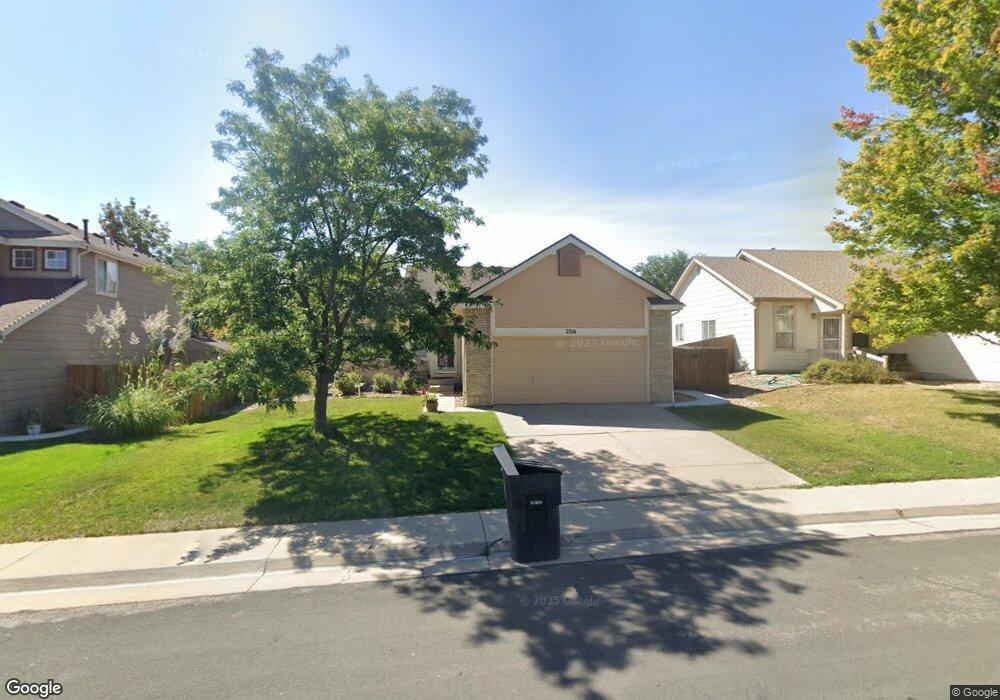
- 2226 E 97th Ave
- 2206 E 97th Ave
- 2207 E 97th Cir
- 2217 E 97th Cir
- 2196 E 97th Ave
- 2236 E 97th Ave
- 2201 E 97th Ave
- 2197 E 97th Cir
- 2221 E 97th Ave
- 2237 E 97th Cir
- 2191 E 97th Ave
- 2176 E 97th Ave
- 2241 E 97th Ave
- 2171 E 97th Ave
- 2256 E 97th Ave
- 2198 E 97th Cir
- 2182 E 97th Dr
- 9688 Harris Cir
- 2192 E 97th Dr
- 2073 E 97th Place
Your Personal Tour Guide
Ask me questions while you tour the home.