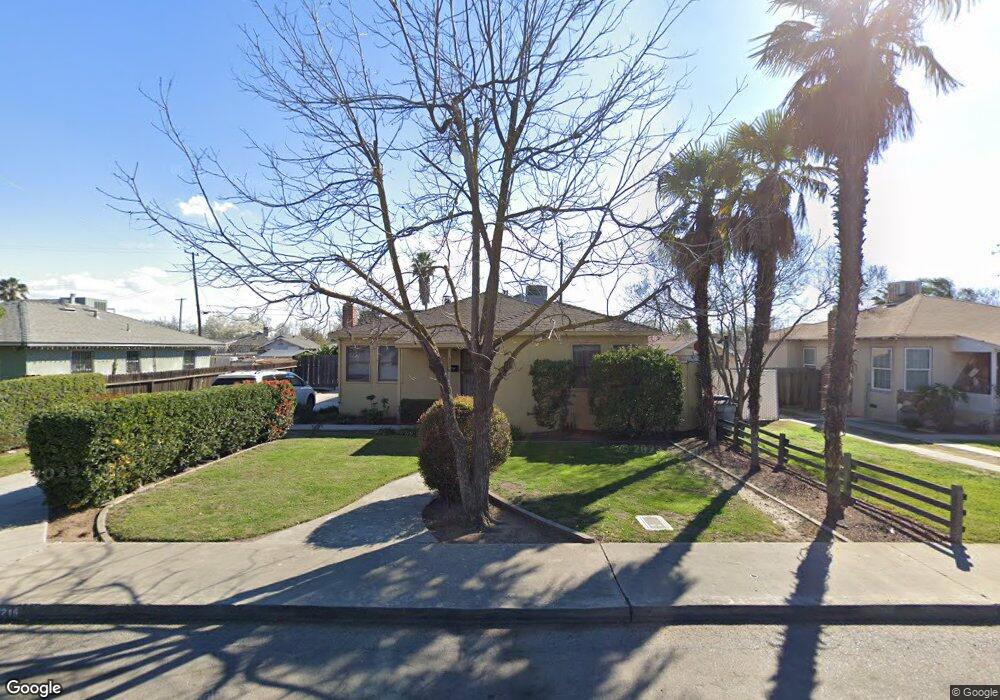
2216 E Cambridge Ave Fresno, CA 93703
McLane NeighborhoodEstimated Value: $305,000 - $363,669
4
Beds
2
Baths
1,984
Sq Ft
$170/Sq Ft
Est. Value
About This Home
This home is located at 2216 E Cambridge Ave, Fresno, CA 93703 and is currently estimated at $336,417, approximately $169 per square foot. 2216 E Cambridge Ave is a home located in Fresno County with nearby schools including Heaton Elementary, Fort Miller Middle School, and Fresno High School.
Ownership History
Date
Name
Owned For
Owner Type
Purchase Details
Closed on
Jul 19, 2023
Sold by
Theodore R Johnson Revocable Trust
Bought by
Golden Sean
Current Estimated Value
Purchase Details
Closed on
Jul 18, 2023
Sold by
Theodore R Johnson Revocable Trust
Bought by
Golden Sean
Purchase Details
Closed on
Oct 10, 2019
Sold by
Johnson Daisy Mae and Johnson Theodore R
Bought by
Mabry Walter C
Home Financials for this Owner
Home Financials are based on the most recent Mortgage that was taken out on this home.
Original Mortgage
$160,000
Interest Rate
3.7%
Mortgage Type
Commercial
Purchase Details
Closed on
Sep 29, 2009
Sold by
Quality Group Homes Inc
Bought by
Johnson Theodore R and Johnson Daisy Mae
Purchase Details
Closed on
Oct 18, 1999
Sold by
Johnson Theodore R and Mae Daisy
Bought by
Quality Group Homes Inc
Home Financials for this Owner
Home Financials are based on the most recent Mortgage that was taken out on this home.
Original Mortgage
$89,370
Interest Rate
7.75%
Mortgage Type
Seller Take Back
Create a Home Valuation Report for This Property
The Home Valuation Report is an in-depth analysis detailing your home's value as well as a comparison with similar homes in the area
Home Values in the Area
Average Home Value in this Area
Purchase History
| Date | Buyer | Sale Price | Title Company |
|---|---|---|---|
| Golden Sean | -- | None Listed On Document | |
| Mabry Walter C | -- | None Listed On Document | |
| Golden Sean | -- | None Listed On Document | |
| Mabry Walter C | -- | None Listed On Document | |
| Mabry Walter C | $170,000 | Chicago Title Company | |
| Johnson Theodore R | -- | None Available | |
| Quality Group Homes Inc | $99,500 | Fidelity National Title Co |
Source: Public Records
Mortgage History
| Date | Status | Borrower | Loan Amount |
|---|---|---|---|
| Previous Owner | Mabry Walter C | $160,000 | |
| Previous Owner | Quality Group Homes Inc | $89,370 |
Source: Public Records
Tax History Compared to Growth
Tax History
| Year | Tax Paid | Tax Assessment Tax Assessment Total Assessment is a certain percentage of the fair market value that is determined by local assessors to be the total taxable value of land and additions on the property. | Land | Improvement |
|---|---|---|---|---|
| 2025 | $2,879 | $220,911 | $43,743 | $177,168 |
| 2023 | $2,717 | $212,336 | $42,046 | $170,290 |
| 2022 | $2,680 | $208,173 | $41,222 | $166,951 |
| 2021 | $2,606 | $204,092 | $40,414 | $163,678 |
| 2020 | $2,595 | $202,000 | $40,000 | $162,000 |
| 2019 | $819 | $63,638 | $28,926 | $34,712 |
| 2018 | $802 | $62,391 | $28,359 | $34,032 |
| 2017 | $788 | $61,168 | $27,803 | $33,365 |
| 2016 | $763 | $59,969 | $27,258 | $32,711 |
| 2015 | $752 | $59,069 | $26,849 | $32,220 |
| 2014 | $735 | $57,913 | $26,324 | $31,589 |
Source: Public Records
Map
Nearby Homes
- 2021 N Fresno St
- 1586 N Calaveras St
- 1409 E Cambridge Ave
- 1824 E Cornell Ave
- 2625 E Michigan Ave
- 2026 E Simpson Ave
- 1211 E Clinton Ave
- 1346 E Princeton Ave
- 2916 E Michigan Ave
- 1329 E Princeton Ave
- 2136 N First St
- 2121 E Hammond Ave
- 1010 E Vassar Ave
- 3030 E Home Ave
- 2414 N 1st St
- 1134 E Princeton Ave
- 1334 N Glenn Ave
- 1126 E Princeton Ave
- 1303 N Calaveras St
- 1452 N Poplar Ave
- 2226 E Cambridge Ave
- 2206 E Cambridge Ave
- 2144 E Cambridge Ave
- 2234 E Cambridge Ave
- 2215 E Weldon Ave
- 2205 E Weldon Ave
- 2225 E Weldon Ave
- 2219 E Cambridge Ave
- 2244 E Cambridge Ave
- 2207 E Cambridge Ave
- 2145 E Weldon Ave
- 2235 E Weldon Ave
- 2231 E Cambridge Ave
- 2143 E Cambridge Ave
- 2135 E Weldon Ave
- 2245 E Weldon Ave
- 2124 E Cambridge Ave
- 2129 E Cambridge Ave
- 2222 E Berkeley Ave
- 2125 E Weldon Ave