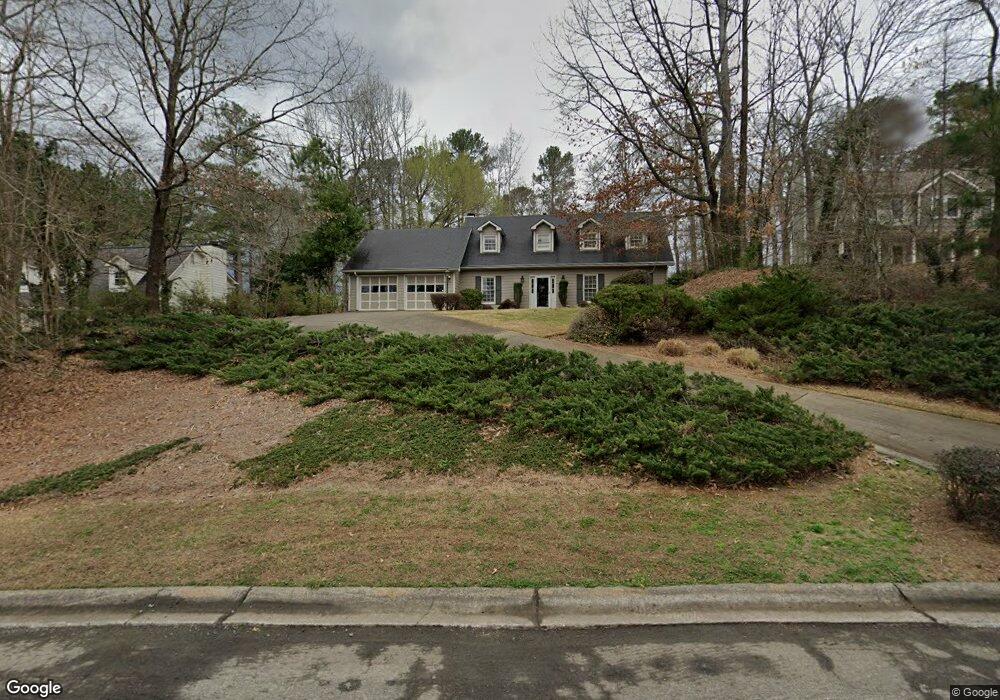
2216 Heritage Trace View Marietta, GA 30062
East Cobb NeighborhoodEstimated Value: $566,000 - $589,519
3
Beds
3
Baths
1,650
Sq Ft
$352/Sq Ft
Est. Value
About This Home
This home is located at 2216 Heritage Trace View, Marietta, GA 30062 and is currently estimated at $580,880, approximately $352 per square foot. 2216 Heritage Trace View is a home located in Cobb County with nearby schools including Timber Ridge Elementary School, Dodgen Middle School, and Walton High School.
Ownership History
Date
Name
Owned For
Owner Type
Purchase Details
Closed on
Sep 16, 2009
Sold by
Bunde Lawrence
Bought by
Knorr Kylie M
Current Estimated Value
Home Financials for this Owner
Home Financials are based on the most recent Mortgage that was taken out on this home.
Original Mortgage
$248,270
Outstanding Balance
$161,377
Interest Rate
5.15%
Mortgage Type
FHA
Estimated Equity
$419,503
Purchase Details
Closed on
Feb 25, 1999
Sold by
Vandewalker Pamela C and Vandewalker David W
Bought by
Simmons Carl B and Simmons Jennifer
Home Financials for this Owner
Home Financials are based on the most recent Mortgage that was taken out on this home.
Original Mortgage
$134,600
Interest Rate
6.73%
Mortgage Type
New Conventional
Purchase Details
Closed on
Feb 16, 1996
Sold by
Harris H Dewey
Bought by
Vandewalker Pamela C David W
Create a Home Valuation Report for This Property
The Home Valuation Report is an in-depth analysis detailing your home's value as well as a comparison with similar homes in the area
Home Values in the Area
Average Home Value in this Area
Purchase History
| Date | Buyer | Sale Price | Title Company |
|---|---|---|---|
| Knorr Kylie M | $259,000 | -- | |
| Simmons Carl B | $168,300 | -- | |
| Vandewalker Pamela C David W | $149,900 | -- |
Source: Public Records
Mortgage History
| Date | Status | Borrower | Loan Amount |
|---|---|---|---|
| Open | Knorr Kylie M | $248,270 | |
| Previous Owner | Simmons Carl B | $134,600 | |
| Closed | Vandewalker Pamela C David W | $0 |
Source: Public Records
Tax History Compared to Growth
Tax History
| Year | Tax Paid | Tax Assessment Tax Assessment Total Assessment is a certain percentage of the fair market value that is determined by local assessors to be the total taxable value of land and additions on the property. | Land | Improvement |
|---|---|---|---|---|
| 2025 | $4,890 | $204,396 | $42,000 | $162,396 |
| 2024 | $4,894 | $204,396 | $42,000 | $162,396 |
| 2023 | $4,084 | $192,080 | $38,000 | $154,080 |
| 2022 | $3,843 | $154,628 | $38,000 | $116,628 |
| 2021 | $3,342 | $131,736 | $35,200 | $96,536 |
| 2020 | $3,342 | $131,736 | $35,200 | $96,536 |
| 2019 | $3,197 | $125,100 | $35,200 | $89,900 |
| 2018 | $3,197 | $125,100 | $35,200 | $89,900 |
| 2017 | $2,661 | $106,068 | $33,200 | $72,868 |
| 2016 | $2,404 | $94,300 | $34,000 | $60,300 |
| 2015 | $2,439 | $93,260 | $27,200 | $66,060 |
| 2014 | $2,459 | $93,260 | $0 | $0 |
Source: Public Records
Map
Nearby Homes
- 2212 Heritage Trace View
- 5250 Pikes Peak Ct
- 1929 Fields Pond Glen
- 2743 Chimney Springs Dr
- 1961 Fields Pond Dr
- 2255 Rushmore Dr
- 2482 N Forest Dr
- 4789 Waterhaven Bend
- 2066 Old Forge Way
- 2655 Boulder Creek Dr NE
- 2661 Sandpoint Way NE
- 2281 Fox Hound Pkwy
- 4780 Waterhaven Bend
- 4586 Hunting Hound Ln
- 2100 Stone Hollow Ct
- 2039 Old Forge Way
- 1804 Shelburne Ridge
- 2218 Heritage Trace View
- 2214 Heritage Trace View Unit 3
- 2220 Heritage Trace View
- 2321 N Forest Dr
- 2209 Heritage Trace View
- 2327 N Forest Dr
- 2211 Heritage Trace View
- 4979 SiMcOe Cir
- 2315 N Forest Dr
- 2213 Heritage Trace View
- 2222 Heritage Trace View Unit 2222
- 2222 Heritage Trace View
- 2210 Heritage Trace View
- 4989 SiMcOe Cir
- 2205 Heritage Trace View Unit 3
- 2309 N Forest Dr
- 2206 Heritage Trace View Unit 3
- 2224 Heritage Trace View
- 2215 Heritage Trace View
- 4982 SiMcOe Cir