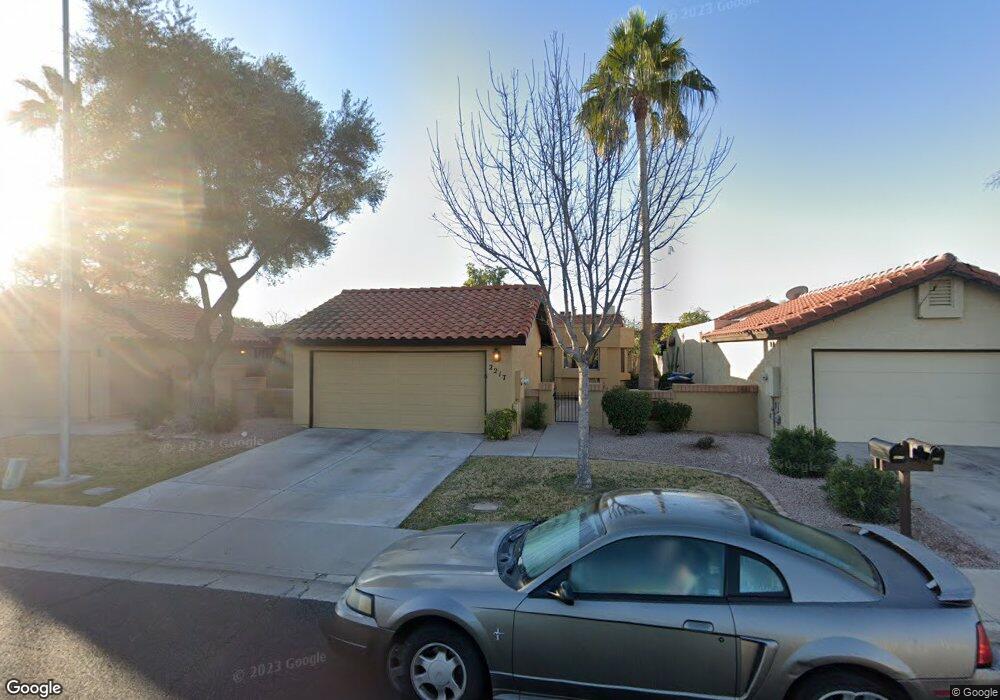
2217 E Forge Ave Mesa, AZ 85204
Central Mesa NeighborhoodEstimated Value: $336,426 - $373,000
Studio
2
Baths
1,339
Sq Ft
$267/Sq Ft
Est. Value
About This Home
This home is located at 2217 E Forge Ave, Mesa, AZ 85204 and is currently estimated at $356,857, approximately $266 per square foot. 2217 E Forge Ave is a home located in Maricopa County with nearby schools including Franklin at Brimhall Elementary School, Franklin West Elementary School, and Franklin Accelerated Academy Jordan Campus.
Ownership History
Date
Name
Owned For
Owner Type
Purchase Details
Closed on
Feb 23, 2015
Sold by
Thompson Ross Dewitt
Bought by
Bigelow Brian K and Bigelow Diana E
Current Estimated Value
Home Financials for this Owner
Home Financials are based on the most recent Mortgage that was taken out on this home.
Original Mortgage
$139,677
Outstanding Balance
$107,415
Interest Rate
3.87%
Mortgage Type
FHA
Estimated Equity
$249,442
Purchase Details
Closed on
Feb 15, 2005
Sold by
Thompson Lynn M and Bigelow Brian K
Bought by
Thompson Monte Ross and Dethompson Gwennal
Purchase Details
Closed on
Feb 21, 2002
Sold by
Harre John C and Harre Louise
Bought by
Thompson Lynn M and Bigelow Brian K
Home Financials for this Owner
Home Financials are based on the most recent Mortgage that was taken out on this home.
Original Mortgage
$113,981
Interest Rate
6.78%
Mortgage Type
FHA
Create a Home Valuation Report for This Property
The Home Valuation Report is an in-depth analysis detailing your home's value as well as a comparison with similar homes in the area
Home Values in the Area
Average Home Value in this Area
Purchase History
| Date | Buyer | Sale Price | Title Company |
|---|---|---|---|
| Bigelow Brian K | -- | Security Title Agency | |
| Thompson Monte Ross | -- | -- | |
| Thompson Lynn M | $115,000 | Capital Title Agency Inc |
Source: Public Records
Mortgage History
| Date | Status | Borrower | Loan Amount |
|---|---|---|---|
| Open | Bigelow Brian K | $139,677 | |
| Previous Owner | Thompson Lynn M | $113,981 |
Source: Public Records
Tax History
| Year | Tax Paid | Tax Assessment Tax Assessment Total Assessment is a certain percentage of the fair market value that is determined by local assessors to be the total taxable value of land and additions on the property. | Land | Improvement |
|---|---|---|---|---|
| 2025 | $1,052 | $12,662 | -- | -- |
| 2024 | $1,063 | $12,059 | -- | -- |
| 2023 | $1,063 | $26,300 | $5,260 | $21,040 |
| 2022 | $1,040 | $19,860 | $3,970 | $15,890 |
| 2021 | $1,068 | $18,800 | $3,760 | $15,040 |
| 2020 | $1,054 | $17,120 | $3,420 | $13,700 |
| 2019 | $976 | $15,230 | $3,040 | $12,190 |
| 2018 | $932 | $14,410 | $2,880 | $11,530 |
| 2017 | $903 | $13,210 | $2,640 | $10,570 |
| 2016 | $887 | $12,080 | $2,410 | $9,670 |
| 2015 | $837 | $11,230 | $2,240 | $8,990 |
Source: Public Records
Map
Nearby Homes
- 1116 S Chestnut
- 2205 E El Moro Ave
- 2126 E Enid Ave
- 2148 E Emelita Ave
- 2202 E Hampton Ave
- 2165 E Hampton Ave
- 2259 E Harmony Ave
- 2339 E Harmony Ave
- 2226 E Diamond Ave
- 861 S Toltec
- 1926 E Delta Ave
- 1927 E Hampton Ave Unit 207
- 1927 E Hampton Ave Unit 263
- 1356 S Yale
- 1909 E 6th Ave
- 2639 E Harmony Ave
- 628 S 26th St
- 1260 S Lindsay Rd Unit 38
- 1626 E Garnet Ave
- 2601 E Hopi Ave
- 2211 E Forge Ave
- 2225 E Forge Ave
- 2205 E Forge Ave
- 2229 E Forge Ave
- 2218 E Fairview Ave
- 2226 E Fairview Ave
- 2212 E Fairview Ave
- 2167 E Forge Ave
- 2235 E Forge Ave
- 2206 E Fairview Ave
- 2232 E Fairview Ave
- 2216 E Forge Ave
- 2222 E Forge Ave
- 2161 E Forge Ave
- 2238 E Fairview Ave
- 2228 E Forge Ave
- 2243 E Forge Ave
- 2204 E Forge Ave
- 2156 E Fairview Ave
- 2242 E Fairview Ave
Your Personal Tour Guide
Ask me questions while you tour the home.