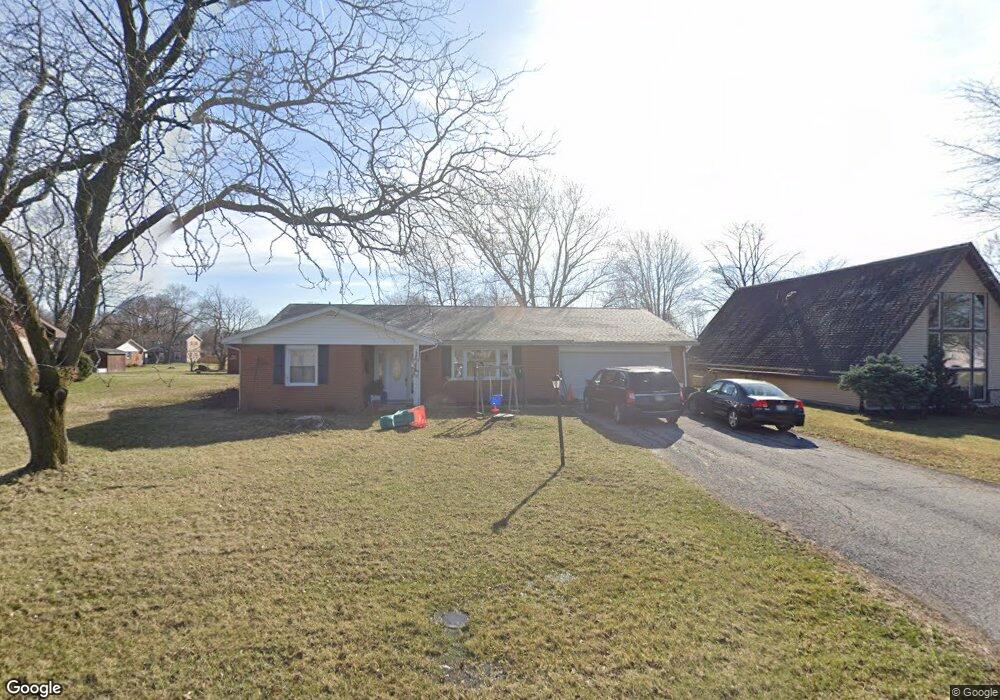
2217 Northridge Rd Findlay, OH 45840
Estimated Value: $214,000 - $307,000
3
Beds
2
Baths
1,853
Sq Ft
$143/Sq Ft
Est. Value
About This Home
This home is located at 2217 Northridge Rd, Findlay, OH 45840 and is currently estimated at $265,158, approximately $143 per square foot. 2217 Northridge Rd is a home located in Hancock County with nearby schools including Bigelow Hill Elementary School, Northview Elementary School, and Glenwood Middle School.
Ownership History
Date
Name
Owned For
Owner Type
Purchase Details
Closed on
Apr 20, 2022
Sold by
Conley Philip D
Bought by
Conley Philip D and Conley Julie A
Current Estimated Value
Home Financials for this Owner
Home Financials are based on the most recent Mortgage that was taken out on this home.
Original Mortgage
$165,852
Interest Rate
4.42%
Mortgage Type
FHA
Purchase Details
Closed on
Jan 20, 1998
Sold by
Campbell Lorraine
Bought by
Conley Philip
Home Financials for this Owner
Home Financials are based on the most recent Mortgage that was taken out on this home.
Original Mortgage
$99,000
Interest Rate
7.24%
Mortgage Type
New Conventional
Purchase Details
Closed on
May 3, 1988
Bought by
Campbell Paul D and Campbell Lorraine
Create a Home Valuation Report for This Property
The Home Valuation Report is an in-depth analysis detailing your home's value as well as a comparison with similar homes in the area
Home Values in the Area
Average Home Value in this Area
Purchase History
| Date | Buyer | Sale Price | Title Company |
|---|---|---|---|
| Conley Philip D | -- | Bc Law Firm Pa | |
| Conley Philip | $110,000 | -- | |
| Campbell Paul D | -- | -- |
Source: Public Records
Mortgage History
| Date | Status | Borrower | Loan Amount |
|---|---|---|---|
| Previous Owner | Conley Philip D | $165,852 | |
| Previous Owner | Conley Philip | $99,000 |
Source: Public Records
Tax History Compared to Growth
Tax History
| Year | Tax Paid | Tax Assessment Tax Assessment Total Assessment is a certain percentage of the fair market value that is determined by local assessors to be the total taxable value of land and additions on the property. | Land | Improvement |
|---|---|---|---|---|
| 2024 | $2,417 | $66,640 | $11,640 | $55,000 |
| 2023 | $2,420 | $66,640 | $11,640 | $55,000 |
| 2022 | $2,412 | $66,640 | $11,640 | $55,000 |
| 2021 | $2,200 | $52,880 | $11,640 | $41,240 |
| 2020 | $2,200 | $52,880 | $11,640 | $41,240 |
| 2019 | $2,109 | $52,880 | $11,640 | $41,240 |
| 2018 | $1,898 | $43,680 | $9,310 | $34,370 |
| 2017 | $1,899 | $43,680 | $9,310 | $34,370 |
| 2016 | $1,875 | $43,680 | $9,310 | $34,370 |
| 2015 | $2,045 | $46,780 | $9,310 | $37,470 |
| 2014 | $2,046 | $46,780 | $9,310 | $37,470 |
| 2012 | $2,060 | $46,780 | $9,310 | $37,470 |
Source: Public Records
Map
Nearby Homes
- 925 W Melrose Ave
- 905 W Melrose Ave
- 933 Laurel Ln
- 643 Edith Ave
- 0 County Road 223
- 3018 Gleneagle Dr
- 6535 Silver Lake Dr
- 405 Clifton Ave
- 410 Monroe Ave
- 304 Prentiss Ave
- 1310 Muirfield Dr
- 304 Rector Ave
- 3106 Saddlebrook
- 1405 Cypress Lake
- 232 Prentiss Ave
- 615 Hillcrest Ave
- 506 Hillcrest Ave
- 1934 Geffs Ave
- 604 Davis St
- 533 Davis St
- 2225 Northridge Rd
- 2209 Northridge Rd
- 2216 Westmoor Rd
- 2208 Westmoor Rd
- 2301 Northridge Rd
- 2300 Westmoor Rd
- 2220 Northridge Rd
- 940 W Melrose Ave
- 2210 Northridge Rd
- 934 W Melrose Ave
- 2309 Northridge Rd
- 1000 W Melrose Ave
- 928 W Melrose Ave
- 2308 Westmoor Rd
- 2219 Westmoor Rd
- 1008 W Melrose Ave
- 2213 Westmoor Rd
- 2317 Northridge Rd
- 2207 Westmoor Rd
- 920 W Melrose Ave