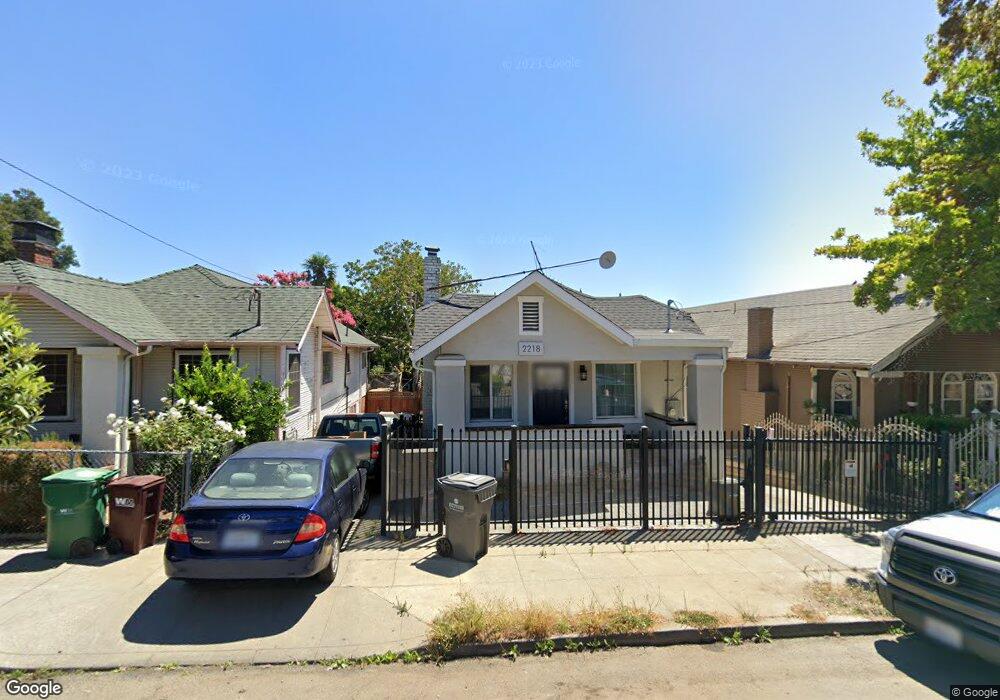
2218 40th Ave Oakland, CA 94601
Jefferson NeighborhoodEstimated Value: $499,000 - $677,365
2
Beds
1
Bath
954
Sq Ft
$653/Sq Ft
Est. Value
About This Home
This home is located at 2218 40th Ave, Oakland, CA 94601 and is currently estimated at $622,591, approximately $652 per square foot. 2218 40th Ave is a home located in Alameda County with nearby schools including Global Family, United For Success Academy, and Urban Promise Academy.
Ownership History
Date
Name
Owned For
Owner Type
Purchase Details
Closed on
May 21, 2021
Sold by
Wilson Truong and Saruca Crystal A
Bought by
Truong Wilson and Truong My Yen
Current Estimated Value
Home Financials for this Owner
Home Financials are based on the most recent Mortgage that was taken out on this home.
Original Mortgage
$429,210
Outstanding Balance
$384,339
Interest Rate
2.9%
Mortgage Type
New Conventional
Estimated Equity
$238,252
Purchase Details
Closed on
Mar 11, 2019
Sold by
Saephan Elizabeth
Bought by
Truong Wilson and Saruca Crystal A
Home Financials for this Owner
Home Financials are based on the most recent Mortgage that was taken out on this home.
Original Mortgage
$443,700
Interest Rate
4.4%
Mortgage Type
New Conventional
Purchase Details
Closed on
Jun 12, 2018
Sold by
Saephan Veun Haw and Saephan Yang Kwen
Bought by
Saephan Elizabeth
Create a Home Valuation Report for This Property
The Home Valuation Report is an in-depth analysis detailing your home's value as well as a comparison with similar homes in the area
Home Values in the Area
Average Home Value in this Area
Purchase History
| Date | Buyer | Sale Price | Title Company |
|---|---|---|---|
| Truong Wilson | $45,409 | Amrock | |
| Truong Wilson | $522,000 | Chicago Title Company | |
| Saephan Elizabeth | -- | Chicago Title Company | |
| Saephan Elizabeth | -- | None Available |
Source: Public Records
Mortgage History
| Date | Status | Borrower | Loan Amount |
|---|---|---|---|
| Open | Truong Wilson | $429,210 | |
| Previous Owner | Truong Wilson | $443,700 |
Source: Public Records
Tax History
| Year | Tax Paid | Tax Assessment Tax Assessment Total Assessment is a certain percentage of the fair market value that is determined by local assessors to be the total taxable value of land and additions on the property. | Land | Improvement |
|---|---|---|---|---|
| 2025 | $10,707 | $709,930 | $174,687 | $542,243 |
| 2024 | $10,707 | $697,274 | $171,262 | $531,612 |
| 2023 | $9,478 | $559,682 | $167,904 | $391,778 |
| 2022 | $9,224 | $548,710 | $164,613 | $384,097 |
| 2021 | $8,808 | $537,951 | $161,385 | $376,566 |
| 2020 | $8,712 | $532,440 | $159,732 | $372,708 |
| 2019 | $4,021 | $203,694 | $61,187 | $142,507 |
| 2018 | $3,941 | $199,701 | $59,988 | $139,713 |
| 2017 | $3,765 | $195,786 | $58,812 | $136,974 |
| 2016 | $3,573 | $191,948 | $57,659 | $134,289 |
| 2015 | $3,551 | $189,065 | $56,793 | $132,272 |
| 2014 | $3,510 | $185,361 | $55,680 | $129,681 |
Source: Public Records
Map
Nearby Homes
- 2063 Rosedale Ave
- 2309 High St
- 2011 Rosedale Ave
- 2123 High St
- 2316 Ransom Ave
- 1978 Rosedale Ave
- 2151 Santa Rita St
- 4510 San Carlos Ave
- 1993 38th Ave
- 1983 38th Ave
- 3708 Lyon Ave
- 4624 Fairfax Ave
- 4010 Foothill Blvd
- 2605 High St
- 3541 Custer St
- 4343 Brookdale Ave
- 3568 Harper St
- 2612 38th Ave
- 1838 40th Ave
- 1818 Rosedale Ave
- 2224 40th Ave
- 2212 40th Ave
- 2206 40th Ave
- 2228 40th Ave
- 2228 40th Ave Unit 2228
- 2230 40th Ave Unit 2230
- 2200 40th Ave
- 2236 40th Ave
- 2205 Rosedale Ave
- 2201 Rosedale Ave
- 2209 Rosedale Ave
- 2194 40th Ave
- 2242 40th Ave
- 2191 Rosedale Ave
- 2215 Rosedale Ave
- 2188 40th Ave
- 2248 40th Ave
- 2219 Rosedale Ave
- 2189 Rosedale Ave
- 2217 40th Ave
Your Personal Tour Guide
Ask me questions while you tour the home.