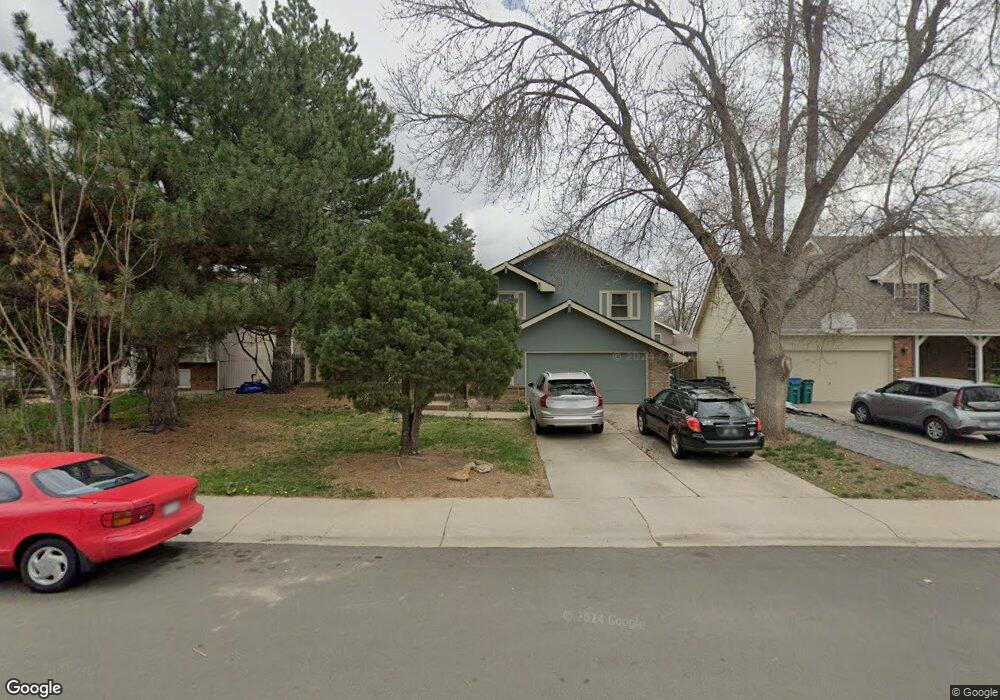
2218 Apache Ct Fort Collins, CO 80525
Mission Hills NeighborhoodEstimated Value: $586,997 - $644,000
3
Beds
3
Baths
1,781
Sq Ft
$346/Sq Ft
Est. Value
About This Home
This home is located at 2218 Apache Ct, Fort Collins, CO 80525 and is currently estimated at $616,499, approximately $346 per square foot. 2218 Apache Ct is a home located in Larimer County with nearby schools including O'Dea Elementary School, Lesher Middle School, and Fort Collins High School.
Ownership History
Date
Name
Owned For
Owner Type
Purchase Details
Closed on
May 13, 2013
Sold by
Clark Donna L
Bought by
Clark Donna L
Current Estimated Value
Home Financials for this Owner
Home Financials are based on the most recent Mortgage that was taken out on this home.
Original Mortgage
$189,500
Outstanding Balance
$134,763
Interest Rate
3.56%
Mortgage Type
New Conventional
Estimated Equity
$481,736
Purchase Details
Closed on
May 31, 2011
Sold by
Clark Donna L
Bought by
Clark Donna L
Purchase Details
Closed on
Apr 19, 2010
Sold by
Clark Gary H and Clark Donna L
Bought by
Clark Gary H and Clark Donna L
Purchase Details
Closed on
Aug 1, 1979
Bought by
Clark Gary H and Clark Donna L
Create a Home Valuation Report for This Property
The Home Valuation Report is an in-depth analysis detailing your home's value as well as a comparison with similar homes in the area
Home Values in the Area
Average Home Value in this Area
Purchase History
| Date | Buyer | Sale Price | Title Company |
|---|---|---|---|
| Clark Donna L | -- | None Available | |
| Clark Donna L | -- | None Available | |
| Clark Gary H | -- | None Available | |
| Clark Gary H | $73,900 | -- |
Source: Public Records
Mortgage History
| Date | Status | Borrower | Loan Amount |
|---|---|---|---|
| Open | Clark Donna L | $189,500 |
Source: Public Records
Tax History
| Year | Tax Paid | Tax Assessment Tax Assessment Total Assessment is a certain percentage of the fair market value that is determined by local assessors to be the total taxable value of land and additions on the property. | Land | Improvement |
|---|---|---|---|---|
| 2025 | $2,836 | $37,725 | $3,125 | $34,600 |
| 2024 | $2,699 | $39,945 | $3,350 | $36,595 |
| 2022 | $2,176 | $29,989 | $3,475 | $26,514 |
| 2021 | $2,199 | $30,852 | $3,575 | $27,277 |
| 2020 | $2,323 | $31,975 | $3,575 | $28,400 |
| 2019 | $2,333 | $31,975 | $3,575 | $28,400 |
| 2018 | $1,727 | $26,150 | $3,600 | $22,550 |
| 2017 | $1,721 | $26,150 | $3,600 | $22,550 |
| 2016 | $1,304 | $22,240 | $3,980 | $18,260 |
| 2015 | $2,016 | $22,240 | $3,980 | $18,260 |
| 2014 | $1,829 | $20,050 | $3,980 | $16,070 |
Source: Public Records
Map
Nearby Homes
- 2400 Stover St
- 616 Tulane Dr
- 925 Columbia Rd Unit 716
- 1909 Pawnee Dr
- 412 Cornell Ave
- 720 E Stuart St
- 1741 Brookhaven Cir E Unit B
- 1732 Brookhaven Cir E Unit A
- 1817 S Lemay Ave
- 834 Cherokee Dr
- 1116 Kirkwood Dr
- 1809 S Lemay Ave
- 1725 Springmeadows Ct Unit C
- 809 E Drake Rd Unit B112
- 1701 Springmeadows Ct Unit D
- 801 E Drake Rd Unit K53
- 705 E Drake Rd Unit P25
- 1633 Ukiah Ln
- 412 Baylor St
- 2701 Stover St Unit C10
- 2224 Apache Ct
- 2212 Apache Ct
- 2225 Shawnee Ct
- 2230 Apache Ct
- 2231 Shawnee Ct
- 2219 Shawnee Ct
- 2206 Apache Ct
- 2237 Shawnee Ct
- 2213 Shawnee Ct
- 2219 Apache Ct
- 2236 Apache Ct
- 2213 Apache Ct
- 2200 Apache Ct
- 2225 Apache Ct
- 2207 Apache Ct
- 2243 Shawnee Ct
- 2207 Shawnee Ct
- 2201 Apache Ct
- 2242 Apache Ct
- 2231 Apache Ct
Your Personal Tour Guide
Ask me questions while you tour the home.