Estimated Value: $552,657 - $810,000
3
Beds
3
Baths
1,924
Sq Ft
$333/Sq Ft
Est. Value
About This Home
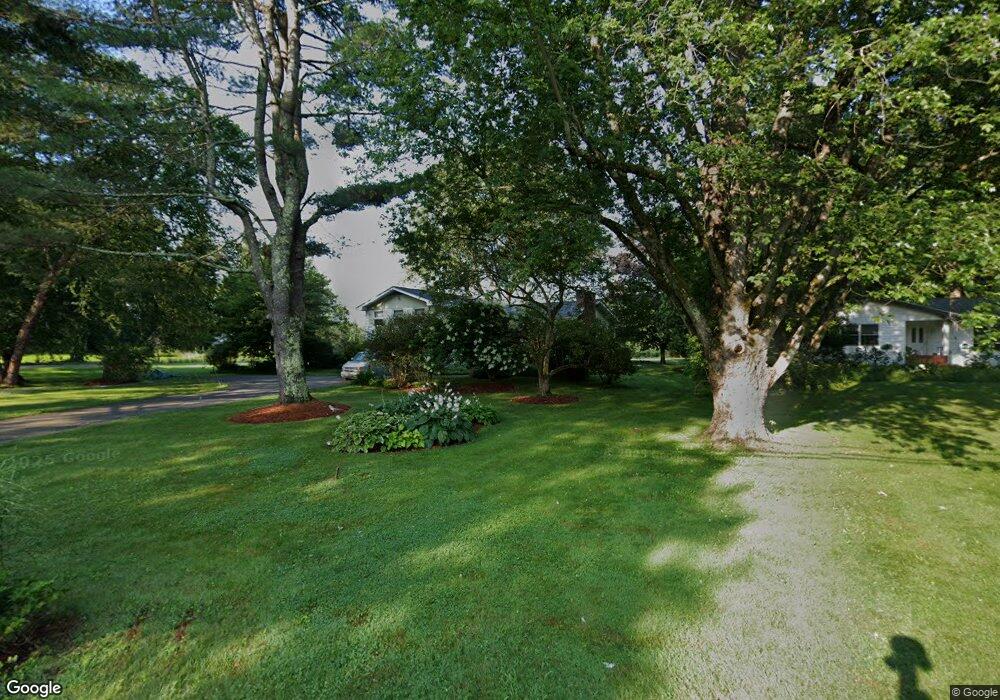
This home is located at 222 Audubon Rd, Leeds, MA 01053 and is currently estimated at $640,414, approximately $332 per square foot. 222 Audubon Rd is a home located in Hampshire County with nearby schools including Northampton High School and Lander Grinspoon Academy.
Ownership History
Date
Name
Owned For
Owner Type
Purchase Details
Closed on
Apr 22, 2009
Sold by
Medaugh Mark D and Crosby Cynthia
Bought by
Medaugh Mark D
Current Estimated Value
Purchase Details
Closed on
Jun 29, 2007
Sold by
Law Gerald C and Mcknight Maureen T
Bought by
Crosby Cynthia and Medaugh Mark D
Home Financials for this Owner
Home Financials are based on the most recent Mortgage that was taken out on this home.
Original Mortgage
$284,000
Interest Rate
6.24%
Mortgage Type
Purchase Money Mortgage
Purchase Details
Closed on
Sep 4, 1998
Sold by
Marmor Robert D and Mitrani Amyjo
Bought by
Law Gerald C and Mcknight Maureen
Home Financials for this Owner
Home Financials are based on the most recent Mortgage that was taken out on this home.
Original Mortgage
$167,000
Interest Rate
6.9%
Mortgage Type
Purchase Money Mortgage
Purchase Details
Closed on
Aug 14, 1992
Sold by
Southard Elaine E and Southard Walter F
Bought by
Mitrani Amy Jo
Create a Home Valuation Report for This Property
The Home Valuation Report is an in-depth analysis detailing your home's value as well as a comparison with similar homes in the area
Home Values in the Area
Average Home Value in this Area
Purchase History
| Date | Buyer | Sale Price | Title Company |
|---|---|---|---|
| Medaugh Mark D | $355,000 | -- | |
| Crosby Cynthia | $355,000 | -- | |
| Law Gerald C | $217,000 | -- | |
| Mitrani Amy Jo | $161,000 | -- |
Source: Public Records
Mortgage History
| Date | Status | Borrower | Loan Amount |
|---|---|---|---|
| Open | Mitrani Amy Jo | $275,793 | |
| Previous Owner | Crosby Cynthia | $284,000 | |
| Previous Owner | Mitrani Amy Jo | $100,000 | |
| Previous Owner | Mitrani Amy Jo | $35,000 | |
| Previous Owner | Mitrani Amy Jo | $167,000 |
Source: Public Records
Tax History Compared to Growth
Tax History
| Year | Tax Paid | Tax Assessment Tax Assessment Total Assessment is a certain percentage of the fair market value that is determined by local assessors to be the total taxable value of land and additions on the property. | Land | Improvement |
|---|---|---|---|---|
| 2025 | $6,876 | $493,600 | $93,700 | $399,900 |
| 2024 | $6,652 | $437,900 | $89,500 | $348,400 |
| 2023 | $6,111 | $385,800 | $81,200 | $304,600 |
| 2022 | $6,052 | $338,300 | $76,200 | $262,100 |
| 2021 | $5,628 | $324,000 | $72,800 | $251,200 |
| 2020 | $5,443 | $324,000 | $72,800 | $251,200 |
| 2019 | $5,419 | $312,000 | $85,300 | $226,700 |
| 2018 | $5,115 | $300,200 | $85,300 | $214,900 |
| 2017 | $5,010 | $300,200 | $85,300 | $214,900 |
| 2016 | $4,851 | $300,200 | $85,300 | $214,900 |
| 2015 | $4,915 | $311,100 | $90,300 | $220,800 |
| 2014 | $4,788 | $311,100 | $90,300 | $220,800 |
Source: Public Records
Map
Nearby Homes
- 481 Kennedy Rd
- 222 River Rd
- 139 Water St
- 44 Evergreen Rd Unit 302
- 107 Front St
- 48 Evergreen Rd Unit 306
- 0 Haydenville Rd
- 158 Main St
- 1 S Main St
- 3 High St
- 58 South St
- 20-11 Sylvester Rd
- 91 Montague Rd
- 404 Sylvester Rd
- 96 Rick Dr
- 84 N Main St
- 45 N Farms Rd
- 37 N Farms Rd
- 67 Park St Unit A
- 67 Park St Unit B