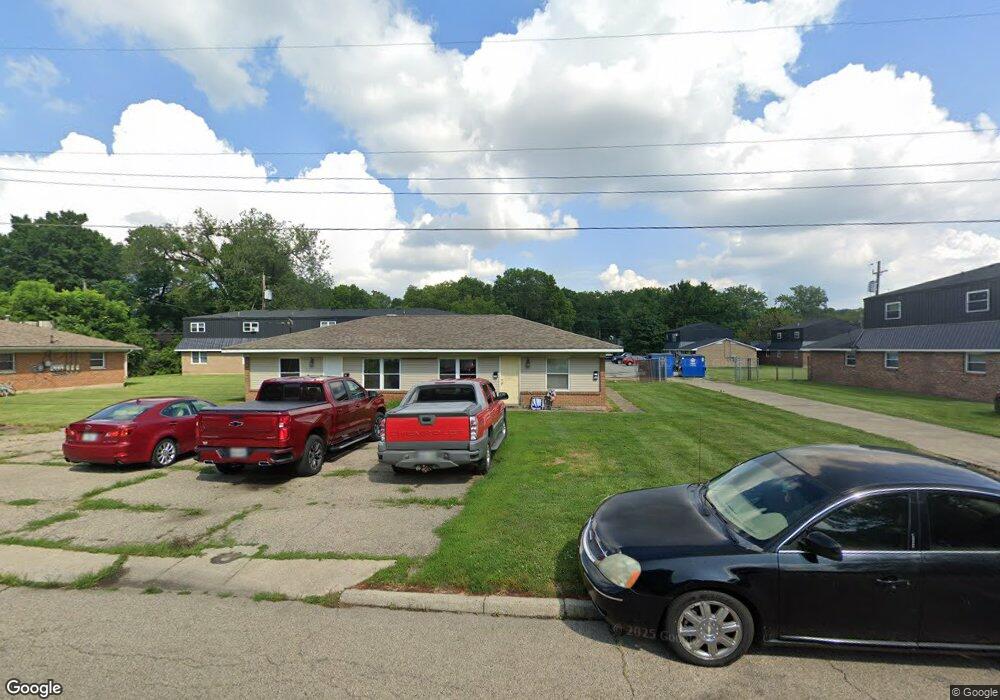
222 Bridge St Franklin, OH 45005
Estimated Value: $130,000 - $586,000
4
Beds
2
Baths
2,262
Sq Ft
$129/Sq Ft
Est. Value
About This Home
This home is located at 222 Bridge St, Franklin, OH 45005 and is currently estimated at $291,000, approximately $128 per square foot. 222 Bridge St is a home located in Warren County with nearby schools including Franklin High School.
Ownership History
Date
Name
Owned For
Owner Type
Purchase Details
Closed on
Sep 16, 2020
Sold by
M A T H Investments
Bought by
Corrine Cottages Llc
Current Estimated Value
Purchase Details
Closed on
Dec 12, 2019
Sold by
The Bank Of New York Mellon
Bought by
Math Investments Llc
Purchase Details
Closed on
Nov 19, 2019
Sold by
Amaranthine Llc
Bought by
The Bank Of New York Mellon and Cwalt Inc
Purchase Details
Closed on
May 14, 2014
Sold by
Guenoc Llc
Bought by
Amaranthine Llc
Purchase Details
Closed on
Jan 20, 2006
Sold by
Fail Gregory C and Johnson Robert D
Bought by
Guenoc Llc
Purchase Details
Closed on
Dec 18, 1992
Sold by
Hiatt George E and Hiatt Alveret
Bought by
Blistan and Blistan William H
Purchase Details
Closed on
May 16, 1979
Sold by
Cronan Cronan and Cronan Jack C
Create a Home Valuation Report for This Property
The Home Valuation Report is an in-depth analysis detailing your home's value as well as a comparison with similar homes in the area
Home Values in the Area
Average Home Value in this Area
Purchase History
| Date | Buyer | Sale Price | Title Company |
|---|---|---|---|
| Corrine Cottages Llc | -- | None Available | |
| Math Investments Llc | $57,000 | Nova Title Agency Inc | |
| The Bank Of New York Mellon | $16,667 | None Available | |
| Amaranthine Llc | -- | None Available | |
| Guenoc Llc | -- | Middletown Title | |
| Blistan | $85,000 | -- | |
| -- | $56,500 | -- |
Source: Public Records
Tax History
| Year | Tax Paid | Tax Assessment Tax Assessment Total Assessment is a certain percentage of the fair market value that is determined by local assessors to be the total taxable value of land and additions on the property. | Land | Improvement |
|---|---|---|---|---|
| 2025 | $2,938 | $54,220 | $21,000 | $33,220 |
| 2024 | $2,938 | $54,220 | $21,000 | $33,220 |
| 2023 | $2,928 | $49,570 | $11,907 | $37,663 |
| 2022 | $2,768 | $49,571 | $11,907 | $37,664 |
| 2021 | $1,971 | $36,316 | $11,907 | $24,409 |
| 2020 | $1,133 | $17,199 | $9,450 | $7,749 |
| 2019 | $872 | $17,199 | $9,450 | $7,749 |
| 2018 | $1,049 | $17,199 | $9,450 | $7,749 |
| 2017 | $1,092 | $16,520 | $9,076 | $7,445 |
| 2016 | $1,111 | $16,520 | $9,076 | $7,445 |
| 2015 | $1,111 | $16,520 | $9,076 | $7,445 |
| 2014 | $1,135 | $16,520 | $9,080 | $7,440 |
| 2013 | $829 | $19,110 | $10,500 | $8,610 |
Source: Public Records
Map
Nearby Homes
- 228 Bridge St
- 0 Victoria Dr Unit 942075
- 0 Victoria Dr Unit 1852824
- 5 S River St
- 413 Spring Ave
- 210 N Riley Blvd
- 605 Spring Ave
- 205 Oxford Rd
- 410 Park Ave
- 616 Lake Ave
- 202 E 2nd St
- 551 E 2nd St
- 509 Forest Ave
- 33 Stadia Dr
- 511 Forest Ave
- 309 Oxford Rd
- 657 E 2nd St
- 651 E 2nd St
- 730 Park Ave
- 712 Abney Ln
- 212 Bridge St Unit B
- 212 Bridge St Unit E
- 232 Bridge St
- 227 Maxwell St
- 223 Maxwell St
- 229 Maxwell St
- 235 Bridge St
- 303 Bridge St
- 231 Maxwell St Unit A
- 231 Maxwell St
- 229 Bridge St
- 309 Bridge St
- 221 Maxwell St
- 118 W Bryant Ave
- 114 W Bryant Ave
- 112 W Bryant Ave
- 120 W Bryant Ave
- 221 Bridge St
- 315 Bridge St
- 219 Maxwell St
Your Personal Tour Guide
Ask me questions while you tour the home.