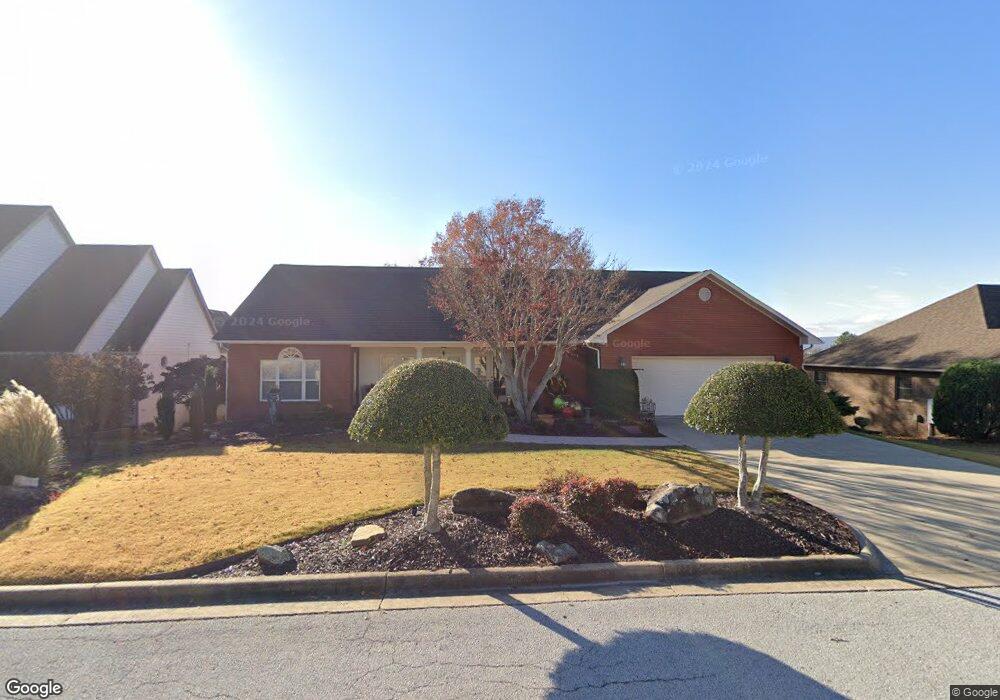
222 Hogan Dr Harrison, AR 72601
Estimated Value: $338,972 - $526,000
4
Beds
3
Baths
3,432
Sq Ft
$127/Sq Ft
Est. Value
About This Home
This home is located at 222 Hogan Dr, Harrison, AR 72601 and is currently estimated at $434,993, approximately $126 per square foot. 222 Hogan Dr is a home located in Boone County with nearby schools including Harrison Kindergarten, Harrison Jr. High School, and Harrison High School.
Ownership History
Date
Name
Owned For
Owner Type
Purchase Details
Closed on
Jul 6, 2021
Sold by
Hemming Living Trust and Burson Robert
Bought by
Johnson Timothy Casey and Johnson Amber Nicole
Current Estimated Value
Home Financials for this Owner
Home Financials are based on the most recent Mortgage that was taken out on this home.
Original Mortgage
$318,250
Outstanding Balance
$288,763
Interest Rate
2.9%
Mortgage Type
New Conventional
Estimated Equity
$146,230
Purchase Details
Closed on
Jun 17, 2004
Bought by
Tori Dale Trust
Purchase Details
Closed on
Sep 13, 2001
Bought by
Miller Trust 2/24/2000
Purchase Details
Closed on
May 1, 2001
Bought by
Miller
Purchase Details
Closed on
Jun 21, 2000
Bought by
Masterson
Purchase Details
Closed on
Aug 31, 1999
Bought by
Trust
Purchase Details
Closed on
Jun 28, 1999
Bought by
Erwin
Purchase Details
Closed on
Aug 13, 1997
Bought by
Bedford
Create a Home Valuation Report for This Property
The Home Valuation Report is an in-depth analysis detailing your home's value as well as a comparison with similar homes in the area
Purchase History
| Date | Buyer | Sale Price | Title Company |
|---|---|---|---|
| Johnson Timothy Casey | $335,000 | Lenders Title Company | |
| Tori Dale Trust | $270,000 | -- | |
| Miller Trust 2/24/2000 | -- | -- | |
| Miller | $230,000 | -- | |
| Masterson | $31,000 | -- | |
| Reese | $31,000 | -- | |
| Trust | -- | -- | |
| Erwin | $31,000 | -- | |
| Bedford | $28,000 | -- |
Source: Public Records
Mortgage History
| Date | Status | Borrower | Loan Amount |
|---|---|---|---|
| Open | Johnson Timothy Casey | $318,250 |
Source: Public Records
Tax History
| Year | Tax Paid | Tax Assessment Tax Assessment Total Assessment is a certain percentage of the fair market value that is determined by local assessors to be the total taxable value of land and additions on the property. | Land | Improvement |
|---|---|---|---|---|
| 2025 | $2,775 | $54,420 | $6,000 | $48,420 |
| 2024 | $2,775 | $54,420 | $6,000 | $48,420 |
| 2023 | $2,775 | $54,420 | $6,000 | $48,420 |
| 2022 | $2,343 | $54,420 | $6,000 | $48,420 |
| 2021 | $2,219 | $54,420 | $6,000 | $48,420 |
| 2020 | $2,096 | $48,450 | $6,000 | $42,450 |
| 2019 | $2,114 | $48,450 | $6,000 | $42,450 |
| 2018 | $2,139 | $48,450 | $6,000 | $42,450 |
| 2017 | $2,471 | $48,450 | $6,000 | $42,450 |
| 2016 | $2,121 | $48,450 | $6,000 | $42,450 |
| 2015 | $2,480 | $48,620 | $5,720 | $42,900 |
| 2014 | $2,130 | $48,620 | $5,720 | $42,900 |
Source: Public Records
Map
Nearby Homes
- 86 Lots Round Mountain Estates
- 307 Pebble Beach Dr
- 1737 Cottonwood Ct
- 203 Pebble Beach Dr
- 1701 Augusta Dr
- 202 Pebble Beach Dr
- 1802 Shellie Ln
- 3107 Belmont Ave Unit 7
- 3101 Belmont Ave
- 3008 Belmont Ave
- 3000 Belmont Ave
- 2002 Hudson Ct
- 1424 Cottonwood Rd
- 107 Nancy St
- Lot 3 Cornerstone Way
- Lot 1 Cornerstone Way
- Lot 4 Cornerstone Way
- Lot 2 Cornerstone Way
- 0 W Hwy 43 Unit 1298701
- 203 Glenview St
Your Personal Tour Guide
Ask me questions while you tour the home.