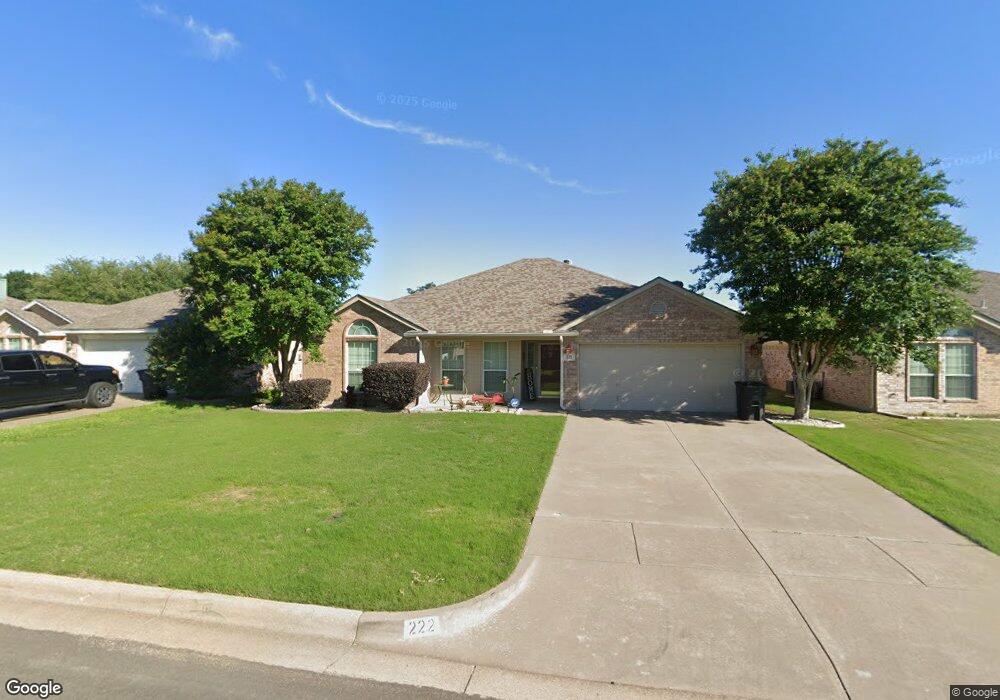
222 Odell St Cleburne, TX 76033
Estimated Value: $275,000 - $288,000
3
Beds
2
Baths
1,904
Sq Ft
$148/Sq Ft
Est. Value
About This Home
This home is located at 222 Odell St, Cleburne, TX 76033 and is currently estimated at $282,214, approximately $148 per square foot. 222 Odell St is a home located in Johnson County with nearby schools including Irving Elementary School, A.D. Wheat Middle School, and Cleburne High School.
Ownership History
Date
Name
Owned For
Owner Type
Purchase Details
Closed on
Oct 13, 2022
Sold by
Maybin Janice M
Bought by
Frasier Cathryn Maybin
Current Estimated Value
Purchase Details
Closed on
Apr 30, 2022
Sold by
Marvin Maybin James
Bought by
Maybin Janice Marie
Purchase Details
Closed on
Apr 16, 2014
Sold by
Allison Linda J
Bought by
Maybin Charles M and Maybin Janice M
Home Financials for this Owner
Home Financials are based on the most recent Mortgage that was taken out on this home.
Original Mortgage
$98,320
Interest Rate
4.34%
Mortgage Type
New Conventional
Purchase Details
Closed on
Apr 9, 2012
Sold by
Smith Tina L
Bought by
Smith Bryan C
Purchase Details
Closed on
Jul 29, 2005
Sold by
Garvey Ray J and Garvey Pamela A
Bought by
Allison Linda J
Home Financials for this Owner
Home Financials are based on the most recent Mortgage that was taken out on this home.
Original Mortgage
$91,750
Interest Rate
5.55%
Mortgage Type
New Conventional
Create a Home Valuation Report for This Property
The Home Valuation Report is an in-depth analysis detailing your home's value as well as a comparison with similar homes in the area
Home Values in the Area
Average Home Value in this Area
Purchase History
| Date | Buyer | Sale Price | Title Company |
|---|---|---|---|
| Frasier Cathryn Maybin | -- | None Listed On Document | |
| Maybin Janice Marie | -- | Strother & Strother Pllc | |
| Maybin Charles M | -- | Rtt | |
| Smith Bryan C | -- | None Available | |
| Allison Linda J | -- | Fnt |
Source: Public Records
Mortgage History
| Date | Status | Borrower | Loan Amount |
|---|---|---|---|
| Previous Owner | Maybin Charles M | $98,320 | |
| Previous Owner | Allison Linda J | $91,750 |
Source: Public Records
Tax History Compared to Growth
Tax History
| Year | Tax Paid | Tax Assessment Tax Assessment Total Assessment is a certain percentage of the fair market value that is determined by local assessors to be the total taxable value of land and additions on the property. | Land | Improvement |
|---|---|---|---|---|
| 2025 | $1,340 | $309,128 | $54,000 | $255,128 |
| 2024 | $6,314 | $283,173 | $0 | $0 |
| 2023 | $1,340 | $309,128 | $54,000 | $255,128 |
| 2022 | $5,857 | $234,027 | $44,500 | $189,527 |
| 2021 | $5,581 | $214,065 | $39,500 | $174,565 |
| 2020 | $5,389 | $196,370 | $25,000 | $171,370 |
| 2019 | $5,224 | $176,783 | $25,000 | $151,783 |
| 2018 | $4,788 | $166,993 | $25,000 | $141,993 |
| 2017 | $4,334 | $157,200 | $25,000 | $132,200 |
| 2016 | $3,940 | $133,853 | $15,000 | $118,853 |
| 2015 | $2,403 | $128,883 | $15,000 | $113,883 |
| 2014 | $2,403 | $128,883 | $15,000 | $113,883 |
Source: Public Records
Map
Nearby Homes
- 315 Rose Ave
- 404 Rose Ave
- 411 Euclid St
- 413 Rose Ave
- 414 Rose Ave
- 422 Rose Ave
- 418 Marengo St
- 426 Rose Ave
- Sherwood Plan at Craftsman's Corner
- Essex Plan at Craftsman's Corner
- Hanover Plan at Craftsman's Corner
- 433 Rose Ave
- 1717 Pipeline Rd
- 1612 N Anglin St
- Robin Plan at Craftsman's Corner
- Cardinal Plan at Craftsman's Corner
- 603 Lilly St
- 1708 Redwood Dr Unit 1706
- 308 Poindexter Ave
- 5348 State Highway 171 Unit 4