222 Sunset Dr Hercules, CA 94547
Estimated Value: $490,000 - $569,000
3
Beds
2
Baths
1,334
Sq Ft
$390/Sq Ft
Est. Value
About This Home
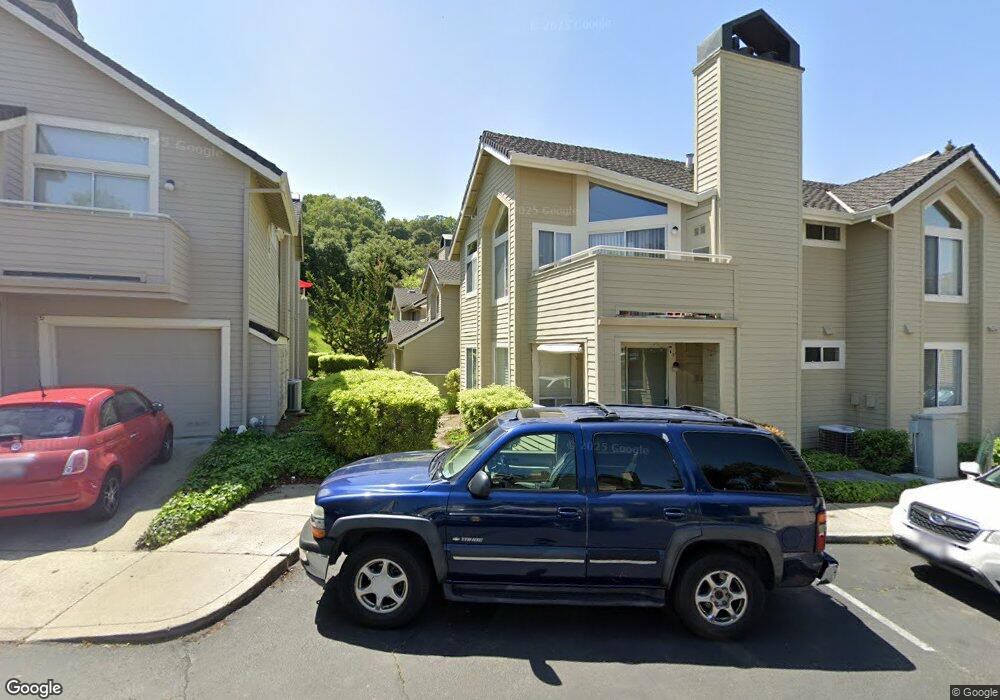
This home is located at 222 Sunset Dr, Hercules, CA 94547 and is currently estimated at $520,217, approximately $389 per square foot. 222 Sunset Dr is a home located in Contra Costa County with nearby schools including Hanna Ranch Elementary School, Hercules Middle School, and Hercules High School.
Ownership History
Date
Name
Owned For
Owner Type
Purchase Details
Closed on
Jun 5, 2012
Sold by
Federal National Mortgage Association
Bought by
Sypraseurt Nor and Sypraseurt Nai
Current Estimated Value
Home Financials for this Owner
Home Financials are based on the most recent Mortgage that was taken out on this home.
Original Mortgage
$184,300
Outstanding Balance
$127,486
Interest Rate
3.79%
Mortgage Type
New Conventional
Estimated Equity
$392,731
Purchase Details
Closed on
Jan 11, 2012
Sold by
Citimortgage Inc
Bought by
Fannie Mae
Purchase Details
Closed on
Dec 29, 2011
Sold by
Garner Tamiko
Bought by
Citimortgage Inc
Purchase Details
Closed on
May 20, 1997
Sold by
Hughes James R and Hughes Lynn A
Bought by
Garner Delano F and Garner Tamiko M
Home Financials for this Owner
Home Financials are based on the most recent Mortgage that was taken out on this home.
Original Mortgage
$128,350
Interest Rate
8.13%
Mortgage Type
FHA
Create a Home Valuation Report for This Property
The Home Valuation Report is an in-depth analysis detailing your home's value as well as a comparison with similar homes in the area
Home Values in the Area
Average Home Value in this Area
Purchase History
We collect this data history from publicly available records. To have your information removed, we recommend requesting removal directly through your county’s website.
| Date | Buyer | Sale Price | Title Company |
|---|---|---|---|
| Sypraseurt Nor | $190,000 | Lawyers Title Insurance Corp | |
| Fannie Mae | -- | None Available | |
| Citimortgage Inc | $122,600 | None Available | |
| Garner Delano F | $132,000 | Old Republic Title Company |
Source: Public Records
Mortgage History
We collect this data history from publicly available records. To have your information removed, we recommend requesting removal directly through your county’s website.
| Date | Status | Borrower | Loan Amount |
|---|---|---|---|
| Open | Sypraseurt Nor | $184,300 | |
| Previous Owner | Garner Delano F | $128,350 |
Source: Public Records
Tax History
| Year | Tax Paid | Tax Assessment Tax Assessment Total Assessment is a certain percentage of the fair market value that is determined by local assessors to be the total taxable value of land and additions on the property. | Land | Improvement |
|---|---|---|---|---|
| 2025 | $4,494 | $238,639 | $41,443 | $197,196 |
| 2024 | $4,280 | $233,961 | $40,631 | $193,330 |
| 2023 | $4,280 | $229,375 | $39,835 | $189,540 |
| 2022 | $4,229 | $224,878 | $39,054 | $185,824 |
| 2021 | $4,219 | $220,470 | $38,289 | $182,181 |
| 2019 | $4,031 | $213,932 | $37,154 | $176,778 |
| 2018 | $3,927 | $209,738 | $36,426 | $173,312 |
| 2017 | $3,875 | $205,626 | $35,712 | $169,914 |
| 2016 | $3,684 | $201,595 | $35,012 | $166,583 |
| 2015 | $3,688 | $198,568 | $34,487 | $164,081 |
| 2014 | $3,698 | $194,679 | $33,812 | $160,867 |
Source: Public Records
Map
Nearby Homes
- 256 Napoli Ct Unit 256
- 166 Catalina Dr
- 406 Grenadine Way
- 121 Violet Rd
- 247 Sparrow Dr
- 4012 Marcas St
- 133 Meadowlark Way
- 2555 Arroyo Ave
- 2724 De la Briandais Ct
- 2 Knoll Ct
- 3724 Carol St
- 3 Arete Ct
- 142 Mesa Ct
- 2662 Tamalpais Dr
- 886 Valley Run
- 2537 Simas Ave
- 405 Weymouth
- 2498 La Reina St
- 810 Dover
- 2420 Tomar Ct
- 233 Sunset Dr
- 231 Sunset Dr
- 235 Sunset Dr
- 229 Sunset Dr
- 237 Sunset Dr Unit 237
- 227 Sunset Dr Unit 227
- 241 Sunset Dr Unit 241
- 225 Sunset Dr
- 221 Sunset Dr
- 223 Sunset Dr
- 239 Sunset Dr
- 243 Sunset Dr
- 245 Sunset Dr
- 226 Sunset Dr Unit 226
- 228 Sunset Dr
- 247 Sunset Dr
- 230 Sunset Dr
- 249 Sunset Dr
- 202 Compass Point Ct
- 206 Compass Point Ct
Your Personal Tour Guide
Ask me questions while you tour the home.