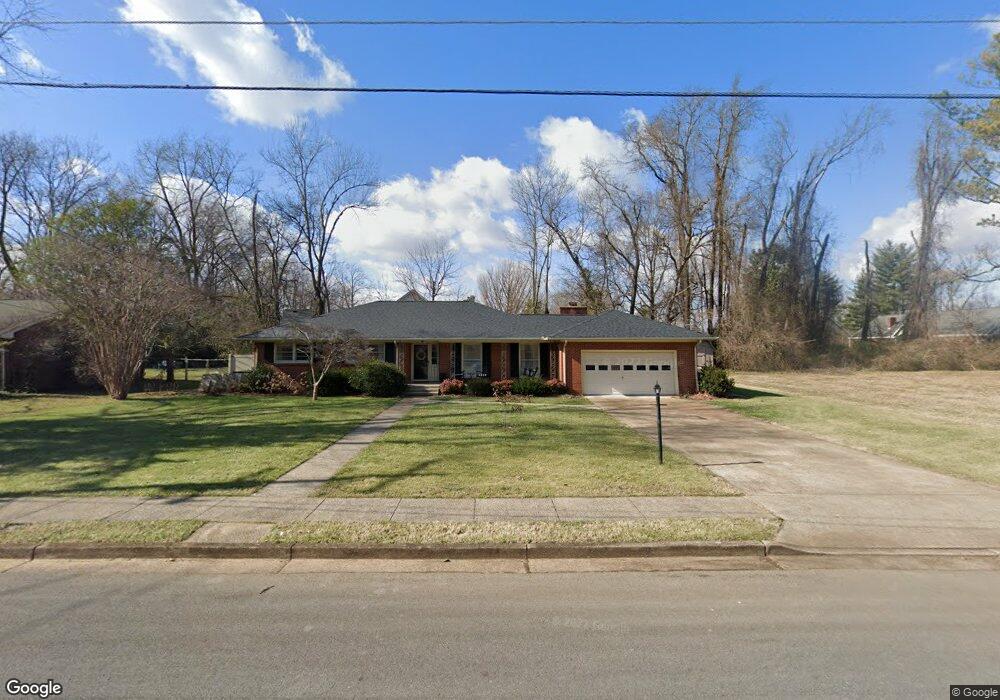
222 Tyne Ave Murfreesboro, TN 37130
Estimated Value: $406,134 - $467,000
--
Bed
3
Baths
2,711
Sq Ft
$160/Sq Ft
Est. Value
About This Home
This home is located at 222 Tyne Ave, Murfreesboro, TN 37130 and is currently estimated at $433,284, approximately $159 per square foot. 222 Tyne Ave is a home located in Rutherford County with nearby schools including Hobgood Elementary School, Whitworth-Buchanan Middle School, and Oakland High School.
Ownership History
Date
Name
Owned For
Owner Type
Purchase Details
Closed on
Sep 24, 2015
Sold by
Millea Family Trust Joseph Ed
Bought by
Florida Jeremy Etux Michelle
Current Estimated Value
Home Financials for this Owner
Home Financials are based on the most recent Mortgage that was taken out on this home.
Original Mortgage
$160,930
Outstanding Balance
$126,270
Interest Rate
3.88%
Mortgage Type
New Conventional
Estimated Equity
$307,014
Purchase Details
Closed on
Jun 27, 2011
Sold by
Millea Joseph Edward
Bought by
Millea Family Trust
Purchase Details
Closed on
Oct 9, 2009
Sold by
Stump Anna Lee
Bought by
Millea Joseph Edward
Home Financials for this Owner
Home Financials are based on the most recent Mortgage that was taken out on this home.
Original Mortgage
$146,400
Interest Rate
5.03%
Create a Home Valuation Report for This Property
The Home Valuation Report is an in-depth analysis detailing your home's value as well as a comparison with similar homes in the area
Home Values in the Area
Average Home Value in this Area
Purchase History
| Date | Buyer | Sale Price | Title Company |
|---|---|---|---|
| Florida Jeremy Etux Michelle | $169,400 | -- | |
| Millea Family Trust | -- | -- | |
| Millea Joseph Edward | $183,000 | -- |
Source: Public Records
Mortgage History
| Date | Status | Borrower | Loan Amount |
|---|---|---|---|
| Open | Florida Jeremy Etux Michelle | $160,930 | |
| Previous Owner | Millea Joseph Edward | $146,400 |
Source: Public Records
Tax History Compared to Growth
Tax History
| Year | Tax Paid | Tax Assessment Tax Assessment Total Assessment is a certain percentage of the fair market value that is determined by local assessors to be the total taxable value of land and additions on the property. | Land | Improvement |
|---|---|---|---|---|
| 2025 | $2,637 | $93,200 | $13,750 | $79,450 |
| 2024 | $2,637 | $93,200 | $13,750 | $79,450 |
| 2023 | $1,764 | $94,025 | $13,750 | $80,275 |
| 2022 | $1,520 | $94,025 | $13,750 | $80,275 |
| 2021 | $1,477 | $66,550 | $10,000 | $56,550 |
| 2020 | $1,477 | $66,550 | $10,000 | $56,550 |
| 2019 | $1,477 | $66,550 | $10,000 | $56,550 |
| 2018 | $2,029 | $66,550 | $0 | $0 |
| 2017 | $1,821 | $46,850 | $0 | $0 |
| 2016 | $1,821 | $46,850 | $0 | $0 |
| 2015 | $1,821 | $46,850 | $0 | $0 |
| 2014 | $1,165 | $46,850 | $0 | $0 |
| 2013 | -- | $45,125 | $0 | $0 |
Source: Public Records
Map
Nearby Homes
- Elder Plan at Richland Downs
- Cedar Plan at Richland Downs
- Hazel Plan at Richland Downs
- 313 Tyne Ave
- 1430 E Main St
- 1301 Richland Place
- 105 4th Ave Unit 105
- 1700 E Main St
- 2251 Middle Tennessee Blvd
- 1522 Dr Martin Luther King jr Blvd
- 1302 Doctor Martin Luther King Jr B Unit 1
- 1302 Doctor Martin Luther King Jr B Unit 49
- 1302 Dr Martin Luther King jr Blvd Unit 32
- 1302 Dr Martin Luther King Blvd Unit 26
- 212 1st Ave
- 1019 E Main St
- 828 E Castle St
- 825 E Vine St
- 411 Apollo Dr
- 1326 Atlas St
- 302 Tyne Ave
- 218 Tyne Ave
- 1324 Richland Place
- 221 Tyne Ave
- 306 Tyne Ave
- 1320 Richland Place
- 211 Tyne Ave
- 303 Tyne Ave
- 214 Tyne Ave
- 1327 Richland Place
- 1316 Richland Place
- 1323 Richland Place
- 305 Tyne Ave
- 310 Tyne Ave
- 210 Tyne Ave
- 1319 Richland Place
- 201 Tyne Ave
- 218 S Baird Ln
- 1312 Richland Place
- 206 Tyne Ave