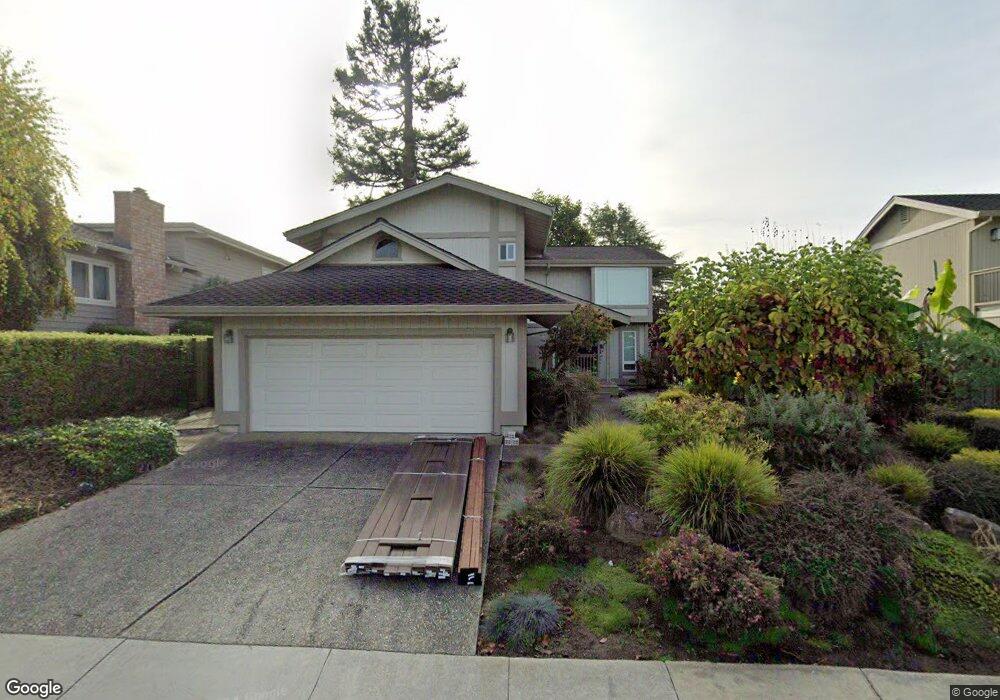
222 Via Lantana Aptos, CA 95003
Rio del Mar NeighborhoodEstimated Value: $1,689,024 - $1,844,000
3
Beds
3
Baths
2,188
Sq Ft
$813/Sq Ft
Est. Value
About This Home
This home is located at 222 Via Lantana, Aptos, CA 95003 and is currently estimated at $1,778,256, approximately $812 per square foot. 222 Via Lantana is a home located in Santa Cruz County with nearby schools including Rio Del Mar Elementary School, Aptos Junior High School, and Aptos High School.
Ownership History
Date
Name
Owned For
Owner Type
Purchase Details
Closed on
Apr 21, 2017
Sold by
Orr Lauri Ann Nirsch and Nirschl Mary
Bought by
Nirschl Thomas G
Current Estimated Value
Purchase Details
Closed on
Nov 21, 2016
Sold by
Nirschl Thomas G and Nirschl Childrens Trust
Bought by
Nirschl Thomas G and Nirschl Laurie Ann Orr
Purchase Details
Closed on
Dec 18, 2012
Sold by
Nirschl Thomas G and Nirschl Living Trust
Bought by
Nirschl Thomas G and Nirschl Childrens Trust
Purchase Details
Closed on
May 18, 2009
Sold by
Nirschl Nancy B and The Nirsch Living Trust
Bought by
Nirschl Nancy B and The Nirschl Living Trust
Purchase Details
Closed on
Sep 15, 2008
Sold by
Nirschl Boyd F and Nirschl Nancy B
Bought by
Nirschl Boyd F and Nirschl Nancy B
Create a Home Valuation Report for This Property
The Home Valuation Report is an in-depth analysis detailing your home's value as well as a comparison with similar homes in the area
Home Values in the Area
Average Home Value in this Area
Purchase History
| Date | Buyer | Sale Price | Title Company |
|---|---|---|---|
| Nirschl Thomas G | $98,000 | None Available | |
| Nirschl Thomas G | -- | None Available | |
| Nirschl Thomas G | -- | Bidwell Title | |
| Nirschl Thomas G | -- | None Available | |
| Nirschl Nancy B | -- | None Available | |
| Nirschl Boyd F | -- | None Available |
Source: Public Records
Tax History Compared to Growth
Tax History
| Year | Tax Paid | Tax Assessment Tax Assessment Total Assessment is a certain percentage of the fair market value that is determined by local assessors to be the total taxable value of land and additions on the property. | Land | Improvement |
|---|---|---|---|---|
| 2025 | $6,397 | $465,866 | $203,312 | $262,554 |
| 2023 | $6,235 | $447,775 | $195,417 | $252,358 |
| 2022 | $6,080 | $438,996 | $191,586 | $247,410 |
| 2021 | $5,836 | $430,388 | $187,829 | $242,559 |
| 2020 | $5,732 | $425,975 | $185,903 | $240,072 |
| 2019 | $5,629 | $417,622 | $182,258 | $235,364 |
| 2018 | $4,338 | $304,462 | $107,337 | $197,125 |
| 2017 | $4,289 | $298,492 | $105,232 | $193,260 |
| 2016 | $4,193 | $292,638 | $103,168 | $189,470 |
| 2015 | $4,118 | $288,242 | $101,618 | $186,624 |
| 2014 | $4,015 | $282,596 | $99,628 | $182,968 |
Source: Public Records
Map
Nearby Homes
- 2146 Penasquitas Dr
- 246 Via Novella
- 126 Via Novella
- 160 Seascape Ridge Dr
- 123 Seascape Resort Dr Unit 123
- 452 Seascape Resort Dr
- 117 Seascape Resort Dr
- 315 Seascape Resort Dr
- 312 Seascape Resort Dr
- 302 Seascape Resort Dr
- 1514 Dolphin Dr
- 153 Castillo Ct
- 190 Driftwood Ct
- 29 Seascape Resort Dr
- 22 Seascape Resort Dr
- 420 Camino al Mar
- 1325 Dolphin Dr
- 436 Camino al Mar
- 8 Cresta Way
- 3 Playa Blvd
- 230 Via Lantana
- 214 Via Lantana
- 238 Via Lantana
- 206 Via Lantana
- 213 Via Trinita
- 205 Via Trinita
- 2235 Dolphin Dr
- 197 Via Trinita
- 221 Via Trinita
- 198 Via Lantana
- 237 Via Lantana
- 189 Via Trinita
- 229 Via Lantana
- 245 Via Lantana
- 229 Via Trinita
- 190 Via Lantana
- 181 Via Trinita
- 213 Via Lantana
- 2277 Dolphin Dr
- 205 Via Lantana