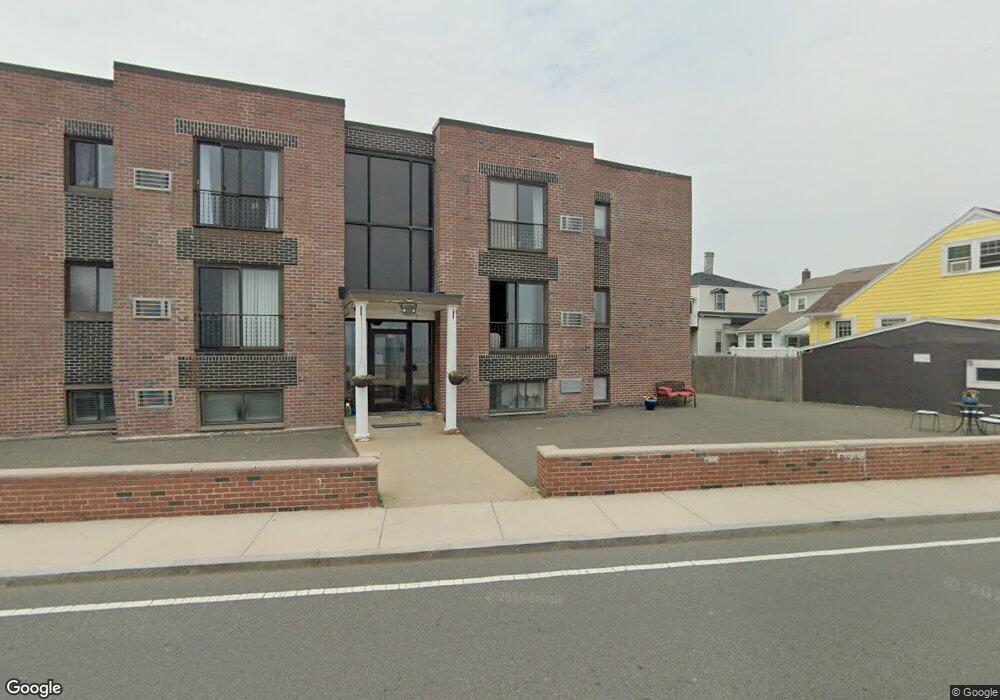
222 Winthrop Shore Dr Unit 2 Winthrop, MA 02152
Winthrop Beach NeighborhoodEstimated Value: $354,000 - $434,000
2
Beds
1
Bath
829
Sq Ft
$467/Sq Ft
Est. Value
About This Home
This home is located at 222 Winthrop Shore Dr Unit 2, Winthrop, MA 02152 and is currently estimated at $387,442, approximately $467 per square foot. 222 Winthrop Shore Dr Unit 2 is a home located in Suffolk County with nearby schools including William P. Gorman/Fort Banks Elementary School, Arthur T. Cummings Elementary School, and Winthrop Middle School.
Ownership History
Date
Name
Owned For
Owner Type
Purchase Details
Closed on
Dec 27, 2011
Sold by
Fnma
Bought by
Reed Barry C
Current Estimated Value
Purchase Details
Closed on
Sep 19, 2011
Sold by
Sullivan Debra L
Bought by
Federal National Mortgage Association
Purchase Details
Closed on
May 1, 2002
Sold by
Talbot Jeffrey E and Tryoer Pamela J
Bought by
Sullivan Debra L
Home Financials for this Owner
Home Financials are based on the most recent Mortgage that was taken out on this home.
Original Mortgage
$123,200
Interest Rate
7.13%
Mortgage Type
Purchase Money Mortgage
Purchase Details
Closed on
Sep 14, 1988
Sold by
Bob Sheridan
Bought by
Sheridan Bob
Create a Home Valuation Report for This Property
The Home Valuation Report is an in-depth analysis detailing your home's value as well as a comparison with similar homes in the area
Home Values in the Area
Average Home Value in this Area
Purchase History
| Date | Buyer | Sale Price | Title Company |
|---|---|---|---|
| Reed Barry C | $53,550 | -- | |
| Federal National Mortgage Association | $190,304 | -- | |
| Sullivan Debra L | $154,000 | -- | |
| Sheridan Bob | $35,000 | -- |
Source: Public Records
Mortgage History
| Date | Status | Borrower | Loan Amount |
|---|---|---|---|
| Previous Owner | Sheridan Bob | $168,000 | |
| Previous Owner | Sheridan Bob | $123,200 | |
| Previous Owner | Sheridan Bob | $30,800 |
Source: Public Records
Tax History Compared to Growth
Tax History
| Year | Tax Paid | Tax Assessment Tax Assessment Total Assessment is a certain percentage of the fair market value that is determined by local assessors to be the total taxable value of land and additions on the property. | Land | Improvement |
|---|---|---|---|---|
| 2025 | $3,308 | $320,500 | $0 | $320,500 |
| 2024 | $2,881 | $276,500 | $0 | $276,500 |
| 2023 | $2,890 | $270,100 | $0 | $270,100 |
| 2022 | $2,899 | $246,500 | $0 | $246,500 |
| 2021 | $2,776 | $218,900 | $0 | $218,900 |
| 2020 | $2,679 | $212,300 | $0 | $212,300 |
| 2019 | $2,666 | $202,300 | $0 | $202,300 |
| 2018 | $2,375 | $167,700 | $0 | $167,700 |
| 2017 | $2,430 | $168,600 | $0 | $168,600 |
| 2016 | $2,129 | $138,500 | $0 | $138,500 |
| 2015 | $1,947 | $135,800 | $0 | $135,800 |
| 2014 | $2,482 | $159,300 | $0 | $159,300 |
Source: Public Records
Map
Nearby Homes
- 10 Beach Rd Unit 1
- 130 Shirley St Unit 204
- 130 Shirley St Unit 202
- 249 Winthrop Shore Dr Unit 6
- 53 Trident Ave Unit 103
- 53 Trident Ave Unit 303
- 37 Trident Ave
- 23 Trident Ave Unit 2
- 80 Shirley St
- 148 Winthrop Shore Dr Unit 5
- 279 Shirley St Unit 2
- 32 Pearl Ave
- 28 Pearl Ave Unit 3
- 41 Summit Ave
- 51 Cutler St Unit 3
- 5 Quincy Ave
- 441 Winthrop St
- 426 Winthrop St
- 800 Governors Dr Unit 6
- 1100 Governors Dr Unit 6
- 222 Winthrop Shore Dr Unit 9
- 222 Winthrop Shore Dr Unit 8
- 222 Winthrop Shore Dr Unit 7
- 222 Winthrop Shore Dr Unit 6
- 222 Winthrop Shore Dr Unit 5
- 222 Winthrop Shore Dr Unit 3
- 222 Winthrop Shore Dr Unit 12
- 222 Winthrop Shore Dr Unit 11
- 222 Winthrop Shore Dr Unit 10
- 222 Winthrop Shore Dr Unit 1
- 222 Withrop Shore Dr Unit 2
- 226 Winthrop Shore Dr
- 44-46 Hawthorn Ave Unit 2
- 44-46 Hawthorn Ave
- 46 Hawthorn Ave Unit 1
- 43 Myrtle Ave
- 37 Myrtle Ave
- 217 Winthrop Shore Dr
- 230 Winthrop Shore Dr
- 51 Hawthorn Ave