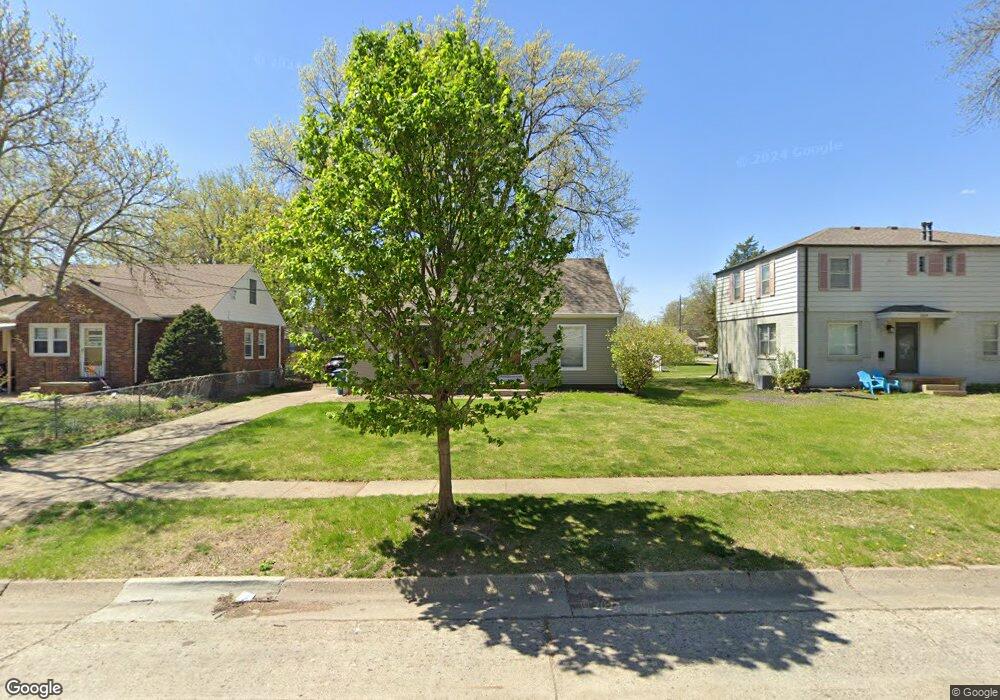
2220 52nd St Des Moines, IA 50310
Merle Hay NeighborhoodEstimated Value: $126,000 - $267,657
4
Beds
1
Bath
1,443
Sq Ft
$145/Sq Ft
Est. Value
About This Home
This home is located at 2220 52nd St, Des Moines, IA 50310 and is currently estimated at $209,914, approximately $145 per square foot. 2220 52nd St is a home located in Polk County with nearby schools including Hillis Elementary School, Merrill Middle School, and Roosevelt High School.
Ownership History
Date
Name
Owned For
Owner Type
Purchase Details
Closed on
Jul 23, 2025
Sold by
Clarence E Smith Revocable Trust and Carol A Smith Revocable Trust
Bought by
Penn Amy Jolene
Current Estimated Value
Home Financials for this Owner
Home Financials are based on the most recent Mortgage that was taken out on this home.
Original Mortgage
$125,000
Outstanding Balance
$124,110
Interest Rate
1.03%
Mortgage Type
New Conventional
Estimated Equity
$85,804
Purchase Details
Closed on
Apr 16, 2021
Sold by
Smith Clarence Eugene and Smith Carol Ann
Bought by
Smith Clarence E and Smith Carol A
Purchase Details
Closed on
Apr 6, 2021
Sold by
Smith Clarence Eugene and Smith Carol Ann
Bought by
Clarence E Smith Revocable Trust and Smith
Purchase Details
Closed on
Jan 29, 2013
Sold by
Smith Clarence Eugene and Smith Carol Ann
Bought by
Penn Amy Jolene
Purchase Details
Closed on
Dec 12, 2012
Sold by
Wardlow Chad D and Wardlow Melisa M
Bought by
Smith Clarence Eugene and Smith Carol Ann
Purchase Details
Closed on
Aug 30, 2002
Sold by
Straight Chad A and Straight Shannon N
Bought by
Wardlow Chad and Cross Melisa
Home Financials for this Owner
Home Financials are based on the most recent Mortgage that was taken out on this home.
Original Mortgage
$109,200
Interest Rate
8.55%
Purchase Details
Closed on
Aug 22, 1998
Sold by
Timmons Janis A
Bought by
Straight Chad A and Straight Shannon N
Home Financials for this Owner
Home Financials are based on the most recent Mortgage that was taken out on this home.
Original Mortgage
$86,330
Interest Rate
7.03%
Create a Home Valuation Report for This Property
The Home Valuation Report is an in-depth analysis detailing your home's value as well as a comparison with similar homes in the area
Home Values in the Area
Average Home Value in this Area
Purchase History
| Date | Buyer | Sale Price | Title Company |
|---|---|---|---|
| Penn Amy Jolene | $125,000 | None Listed On Document | |
| Penn Amy Jolene | $125,000 | None Listed On Document | |
| Smith Clarence E | -- | None Available | |
| Clarence E Smith Revocable Trust | -- | None Listed On Document | |
| Penn Amy Jolene | $127,000 | None Available | |
| Smith Clarence Eugene | $125,000 | None Available | |
| Wardlow Chad | $114,500 | -- | |
| Straight Chad A | $88,500 | -- |
Source: Public Records
Mortgage History
| Date | Status | Borrower | Loan Amount |
|---|---|---|---|
| Open | Penn Amy Jolene | $125,000 | |
| Closed | Penn Amy Jolene | $125,000 | |
| Previous Owner | Wardlow Chad | $109,200 | |
| Previous Owner | Straight Chad A | $86,330 | |
| Closed | Penn Amy Jolene | $0 |
Source: Public Records
Tax History Compared to Growth
Tax History
| Year | Tax Paid | Tax Assessment Tax Assessment Total Assessment is a certain percentage of the fair market value that is determined by local assessors to be the total taxable value of land and additions on the property. | Land | Improvement |
|---|---|---|---|---|
| 2025 | $4,422 | $258,000 | $61,800 | $196,200 |
| 2024 | $4,422 | $235,200 | $55,500 | $179,700 |
| 2023 | $4,386 | $235,200 | $55,500 | $179,700 |
| 2022 | $4,352 | $195,000 | $47,400 | $147,600 |
| 2021 | $4,102 | $195,000 | $47,400 | $147,600 |
| 2020 | $4,256 | $173,000 | $41,800 | $131,200 |
| 2019 | $4,054 | $173,000 | $41,800 | $131,200 |
| 2018 | $4,008 | $159,400 | $37,700 | $121,700 |
| 2017 | $3,738 | $159,400 | $37,700 | $121,700 |
| 2016 | $3,636 | $146,700 | $34,200 | $112,500 |
| 2015 | $3,636 | $146,700 | $34,200 | $112,500 |
| 2014 | $3,484 | $139,800 | $32,000 | $107,800 |
Source: Public Records
Map
Nearby Homes