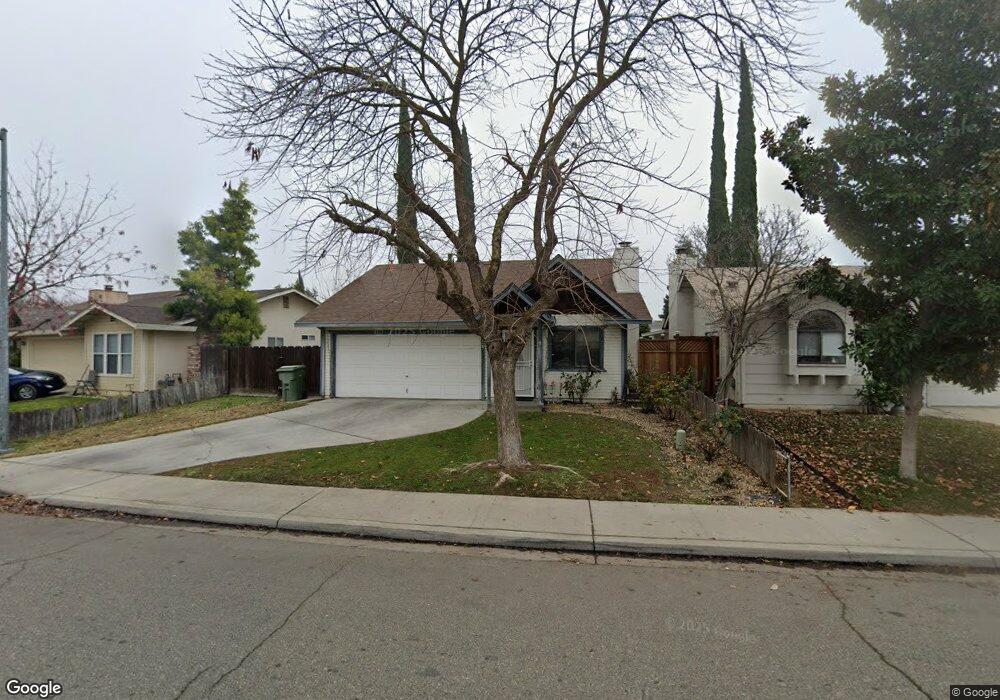
2220 Oxford Ave Turlock, CA 95382
Estimated Value: $354,000 - $365,000
3
Beds
1
Bath
997
Sq Ft
$361/Sq Ft
Est. Value
About This Home
This home is located at 2220 Oxford Ave, Turlock, CA 95382 and is currently estimated at $359,773, approximately $360 per square foot. 2220 Oxford Ave is a home located in Stanislaus County with nearby schools including Walter M. Brown Elementary School, Marvin A. Dutcher Middle School, and Turlock Junior High School.
Ownership History
Date
Name
Owned For
Owner Type
Purchase Details
Closed on
Aug 3, 2017
Sold by
Dias Paul M
Bought by
Galhano Frank V and Galhano Fatima Connie
Current Estimated Value
Home Financials for this Owner
Home Financials are based on the most recent Mortgage that was taken out on this home.
Original Mortgage
$172,500
Outstanding Balance
$143,279
Interest Rate
3.88%
Mortgage Type
New Conventional
Estimated Equity
$216,494
Purchase Details
Closed on
Jun 22, 2017
Sold by
Famil Galhano Fatima Connie and Famil Grimoalda Dias Revocable
Bought by
Dias Paul M
Home Financials for this Owner
Home Financials are based on the most recent Mortgage that was taken out on this home.
Original Mortgage
$172,500
Outstanding Balance
$143,279
Interest Rate
3.88%
Mortgage Type
New Conventional
Estimated Equity
$216,494
Purchase Details
Closed on
Feb 13, 2002
Sold by
Dias Grimoalda O
Bought by
Famil Dias Grimoalda O and Famil Grimoalda Dias Revocable
Create a Home Valuation Report for This Property
The Home Valuation Report is an in-depth analysis detailing your home's value as well as a comparison with similar homes in the area
Home Values in the Area
Average Home Value in this Area
Purchase History
| Date | Buyer | Sale Price | Title Company |
|---|---|---|---|
| Galhano Frank V | $230,000 | Old Republic Title Company | |
| Dias Paul M | -- | Old Republic Title Company | |
| Dias Paul M | -- | None Available | |
| Famil Dias Grimoalda O | -- | -- |
Source: Public Records
Mortgage History
| Date | Status | Borrower | Loan Amount |
|---|---|---|---|
| Open | Galhano Frank V | $172,500 |
Source: Public Records
Tax History Compared to Growth
Tax History
| Year | Tax Paid | Tax Assessment Tax Assessment Total Assessment is a certain percentage of the fair market value that is determined by local assessors to be the total taxable value of land and additions on the property. | Land | Improvement |
|---|---|---|---|---|
| 2025 | $2,809 | $261,697 | $113,781 | $147,916 |
| 2024 | $2,757 | $256,566 | $111,550 | $145,016 |
| 2023 | $2,752 | $251,536 | $109,363 | $142,173 |
| 2022 | $2,718 | $246,605 | $107,219 | $139,386 |
| 2021 | $2,678 | $241,770 | $105,117 | $136,653 |
| 2020 | $2,659 | $239,292 | $104,040 | $135,252 |
| 2019 | $2,615 | $234,600 | $102,000 | $132,600 |
| 2018 | $2,612 | $230,000 | $100,000 | $130,000 |
| 2017 | $1,457 | $128,533 | $42,032 | $86,501 |
| 2016 | $1,360 | $126,013 | $41,208 | $84,805 |
| 2015 | $1,348 | $124,122 | $40,590 | $83,532 |
| 2014 | $1,335 | $121,691 | $39,795 | $81,896 |
Source: Public Records
Map
Nearby Homes
- 2213 Dels Ln
- 2300 Dels Ln
- 517 W Tuolumne Rd
- 2700 Oxford Ave
- 2417 Andre Ln
- 401 W Tuolumne Rd
- 330 Wiley Ct
- 425 20th Century Blvd Unit A13
- 425 20th Century Blvd Unit D3
- 2985 Radford Way
- 100 Pedras Rd
- 2821 Messenger Ct
- 1400 N Tully Rd Unit 173
- 1400 N Tully Rd Unit 187
- 2101 State St
- 3076 Radford Way
- 2900 Andre Ln Unit 241
- 2900 Andre Ln Unit 243
- 2900 Andre Ln Unit 237
- 1321 Trinity Way
- 2200 Oxford Ave
- 2180 Oxford Ave
- 2260 Oxford Ave
- 2159 Garden Ln
- 1004 Jacquelinelee Dr
- 2179 Garden Ln
- 2160 Oxford Ave
- 1001 Jacquelinelee Dr
- 2185 Oxford Ave
- 2139 Garden Ln
- 2290 Oxford Ave
- 1024 Jacquelinelee Dr
- 2165 Oxford Ave
- 1021 Jacquelinelee Dr
- 2140 Oxford Ave
- 2119 Garden Ln
- 1002 Wickel St
- 2145 Oxford Ave
- 982 Wickel St
- 2199 Garden Ln