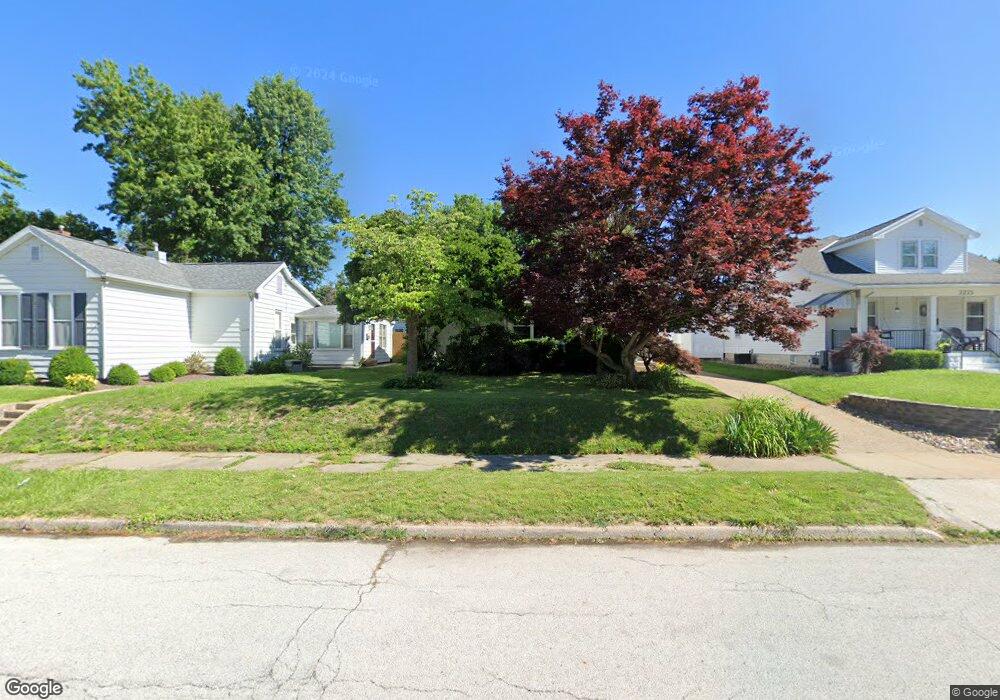
2221 Lind St Quincy, IL 62301
Estimated Value: $185,000 - $214,000
2
Beds
3
Baths
1,350
Sq Ft
$145/Sq Ft
Est. Value
About This Home
This home is located at 2221 Lind St, Quincy, IL 62301 and is currently estimated at $196,102, approximately $145 per square foot. 2221 Lind St is a home located in Adams County with nearby schools including Rooney Elementary School, Quincy Junior High School, and Quincy Senior High School.
Ownership History
Date
Name
Owned For
Owner Type
Purchase Details
Closed on
Nov 13, 2020
Sold by
Sousa Brock A and Sousa Jennifer
Bought by
Brunk Justin Steven and Brunk Sarah Paige
Current Estimated Value
Home Financials for this Owner
Home Financials are based on the most recent Mortgage that was taken out on this home.
Original Mortgage
$137,750
Outstanding Balance
$121,860
Interest Rate
2.48%
Mortgage Type
New Conventional
Estimated Equity
$74,242
Create a Home Valuation Report for This Property
The Home Valuation Report is an in-depth analysis detailing your home's value as well as a comparison with similar homes in the area
Home Values in the Area
Average Home Value in this Area
Purchase History
| Date | Buyer | Sale Price | Title Company |
|---|---|---|---|
| Brunk Justin Steven | $145,000 | Adams County Abstract |
Source: Public Records
Mortgage History
| Date | Status | Borrower | Loan Amount |
|---|---|---|---|
| Open | Brunk Justin Steven | $137,750 |
Source: Public Records
Tax History Compared to Growth
Tax History
| Year | Tax Paid | Tax Assessment Tax Assessment Total Assessment is a certain percentage of the fair market value that is determined by local assessors to be the total taxable value of land and additions on the property. | Land | Improvement |
|---|---|---|---|---|
| 2024 | $3,302 | $56,640 | $3,830 | $52,810 |
| 2023 | $3,079 | $52,540 | $3,550 | $48,990 |
| 2022 | $2,885 | $49,050 | $3,310 | $45,740 |
| 2021 | $2,917 | $48,330 | $3,240 | $45,090 |
| 2020 | $2,188 | $37,730 | $3,180 | $34,550 |
| 2019 | $2,143 | $37,330 | $3,150 | $34,180 |
| 2018 | $2,117 | $36,600 | $3,090 | $33,510 |
| 2017 | $2,061 | $36,240 | $3,060 | $33,180 |
| 2016 | $2,015 | $34,760 | $2,930 | $31,830 |
| 2015 | $1,915,700 | $34,760 | $2,930 | $31,830 |
| 2012 | $1,912 | $33,590 | $2,830 | $30,760 |
Source: Public Records
Map
Nearby Homes