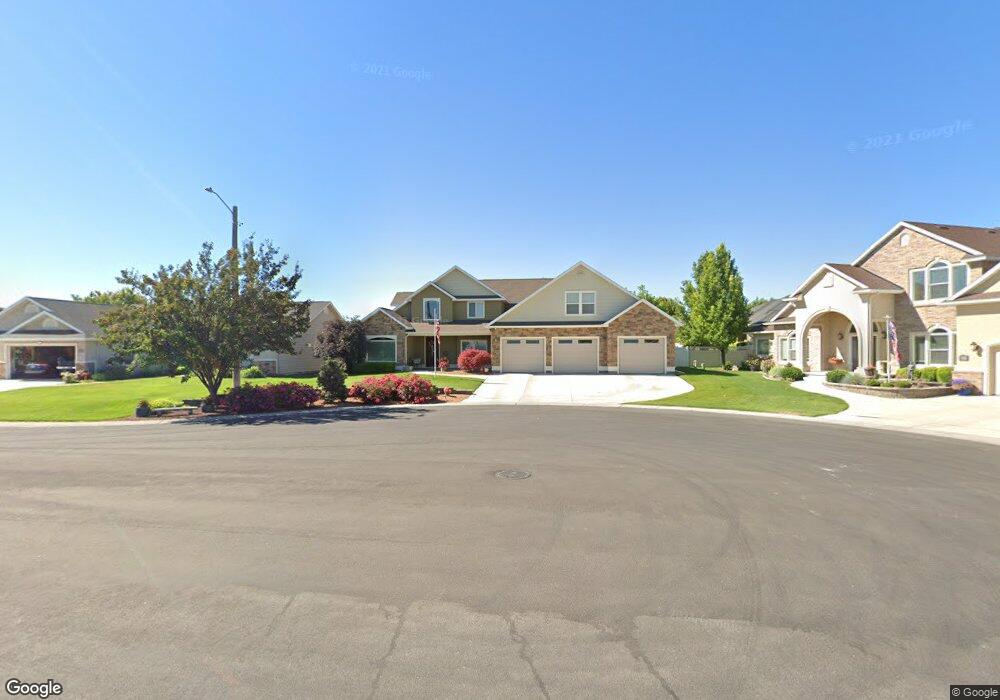
2222 Candleridge East Cir Twin Falls, ID 83301
Estimated Value: $639,000 - $788,000
4
Beds
4
Baths
3,267
Sq Ft
$219/Sq Ft
Est. Value
About This Home
This home is located at 2222 Candleridge East Cir, Twin Falls, ID 83301 and is currently estimated at $716,064, approximately $219 per square foot. 2222 Candleridge East Cir is a home located in Twin Falls County with nearby schools including Sawtooth Elementary School, Vera C. O'Leary Middle School, and Twin Falls Senior High School.
Ownership History
Date
Name
Owned For
Owner Type
Purchase Details
Closed on
Dec 14, 2016
Sold by
Kracke Corey E and Kracke Kimberly R
Bought by
Bevan Michael R and Bevan Joan A
Current Estimated Value
Purchase Details
Closed on
Jan 20, 2015
Sold by
Hamilton Barry K and Hamilton Jacque
Bought by
Kracke Corey E and Kracke Kimberly R
Home Financials for this Owner
Home Financials are based on the most recent Mortgage that was taken out on this home.
Original Mortgage
$280,000
Interest Rate
3.76%
Mortgage Type
New Conventional
Purchase Details
Closed on
Apr 1, 2008
Sold by
Nelson Homes North Llc
Bought by
Hamilton Barry K and Hamilton Jacque
Home Financials for this Owner
Home Financials are based on the most recent Mortgage that was taken out on this home.
Original Mortgage
$309,275
Interest Rate
6.11%
Mortgage Type
New Conventional
Create a Home Valuation Report for This Property
The Home Valuation Report is an in-depth analysis detailing your home's value as well as a comparison with similar homes in the area
Home Values in the Area
Average Home Value in this Area
Purchase History
| Date | Buyer | Sale Price | Title Company |
|---|---|---|---|
| Bevan Michael R | -- | First American Title Twin Fa | |
| Kracke Corey E | -- | First American Title | |
| Hamilton Barry K | -- | Title Fact Inc |
Source: Public Records
Mortgage History
| Date | Status | Borrower | Loan Amount |
|---|---|---|---|
| Previous Owner | Kracke Corey E | $280,000 | |
| Previous Owner | Hamilton Barry K | $309,275 |
Source: Public Records
Tax History Compared to Growth
Tax History
| Year | Tax Paid | Tax Assessment Tax Assessment Total Assessment is a certain percentage of the fair market value that is determined by local assessors to be the total taxable value of land and additions on the property. | Land | Improvement |
|---|---|---|---|---|
| 2024 | $4,536 | $605,217 | $93,358 | $511,859 |
| 2023 | $4,000 | $609,027 | $93,358 | $515,669 |
| 2022 | $5,942 | $643,926 | $85,038 | $558,888 |
| 2021 | $5,590 | $496,319 | $85,038 | $411,281 |
| 2020 | $5,037 | $430,181 | $79,548 | $350,633 |
| 2019 | $5,459 | $405,546 | $63,270 | $342,276 |
| 2018 | $5,663 | $402,422 | $63,270 | $339,152 |
| 2017 | $5,255 | $380,327 | $63,270 | $317,057 |
| 2016 | $5,202 | $354,241 | $0 | $0 |
| 2015 | $5,162 | $354,241 | $63,270 | $290,971 |
| 2012 | -- | $312,334 | $0 | $0 |
Source: Public Records
Map
Nearby Homes
- 2148 Candlewood Ave
- 1567 Mary Alice Lake Way
- 1583 Lagoon Ln
- 1537 Tule Dr
- 1557 Tule Dr
- 1564 Tule Dr
- 1697 Tule Dr
- 1556 Mary Alice Lake Way
- 1677 Tule Dr
- 1628 Tule Dr
- 1410 Pillar St
- 1517 Tule Dr
- 1599 Clear Creek Loop
- 1526 Clear Creek Loop
- 1925 Tamarack Loop
- 1676 Tule Dr
- 1580 Clear Creek Loop
- 1597 Tule Dr
- 1434 Riverbend Place
- 1516 Tule Dr
- 2232 Candleridge Cir E
- 2232 Candleridge East Cir
- 2212 Candleridge East Cir
- 2212 Candleridge Cir E
- 2231 Candleridge Dr
- 2221 Candleridge Dr
- 2252 Candleridge East Cir
- 2252 Candleridge Cir E
- 2213 Candleridge East Cir
- 2223 Candleridge Cir E
- 2213 Candleridge East Cir
- 2211 Candleridge Dr
- 2233 Candleridge East Cir
- 2293 Candleridge Dr
- 2272 Candleridge East Cir
- 2272 Candleridge East Cir
- 2253 Candleridge East Cir
- 2223 Candleridge Dr
- 2228 Candleridge Dr
- 2264 Candleridge Dr