2223 Burnside St Simi Valley, CA 93065
Central Simi Valley NeighborhoodEstimated Value: $819,736 - $913,000
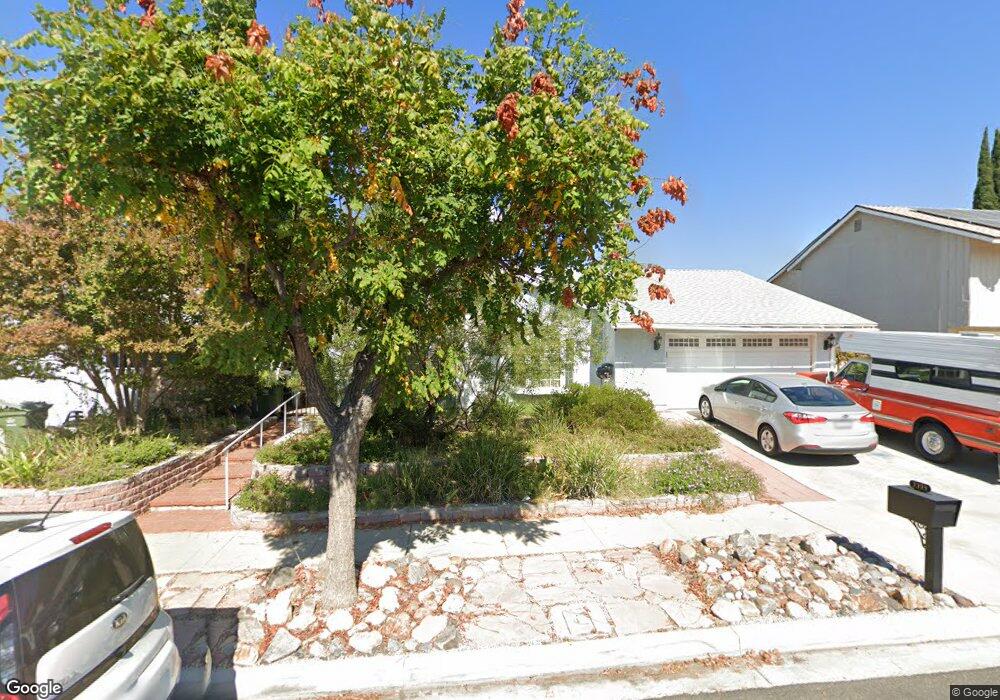
About This Home
This home is located at 2223 Burnside St, Simi Valley, CA 93065 and is currently estimated at $862,934, approximately $428 per square foot. 2223 Burnside St is a home located in Ventura County with nearby schools including Park View Elementary School, Hillside Middle School, and Royal High School.
Ownership History
We collect this data history from publicly available records. To have your information removed, we recommend requesting removal directly through your county’s website.
Purchase Details
Purchase Details
Home Financials for this Owner
Home Financials are based on the most recent Mortgage that was taken out on this home.Purchase Details
Home Financials for this Owner
Home Financials are based on the most recent Mortgage that was taken out on this home.Home Values in the Area
Average Home Value in this Area
Purchase History
We collect this data history from publicly available records. To have your information removed, we recommend requesting removal directly through your county’s website.
| Date | Buyer | Sale Price | Title Company |
|---|---|---|---|
| -- | None Available | ||
| -- | Stewart Title Company | ||
| $365,000 | Stewart Title Company |
Mortgage History
We collect this data history from publicly available records. To have your information removed, we recommend requesting removal directly through your county’s website.
| Date | Status | Borrower | Loan Amount |
|---|---|---|---|
| Open | $254,000 |
Tax History
We collect this data history from publicly available records. To have your information removed, we recommend requesting removal directly through your county’s website.
| Year | Tax Paid | Tax Assessment Tax Assessment Total Assessment is a certain percentage of the fair market value that is determined by local assessors to be the total taxable value of land and additions on the property. | Land | Improvement |
|---|---|---|---|---|
| 2025 | $6,492 | $528,612 | $211,440 | $317,172 |
| 2024 | $6,492 | $518,248 | $207,295 | $310,953 |
| 2023 | $6,105 | $508,087 | $203,231 | $304,856 |
| 2022 | $6,085 | $498,125 | $199,246 | $298,879 |
| 2021 | $6,044 | $488,358 | $195,339 | $293,019 |
| 2020 | $5,921 | $483,352 | $193,337 | $290,015 |
| 2019 | $5,653 | $473,876 | $189,547 | $284,329 |
| 2018 | $5,608 | $464,585 | $185,831 | $278,754 |
| 2017 | $5,486 | $455,477 | $182,188 | $273,289 |
| 2016 | $5,241 | $446,547 | $178,616 | $267,931 |
| 2015 | $5,133 | $439,841 | $175,934 | $263,907 |
| 2014 | $5,064 | $431,228 | $172,489 | $258,739 |
Map
- 2235 Burnside St
- 2148 Elmdale Ave
- 2031 Morning Glory St
- 2371 Larch St
- 2357 Lawnview Ct
- 1877 Fred Ave
- 1536 Earl Ave
- 1908 Morley St
- 2410 N Justin Ave
- 1772 Fred Ave
- 1868 Cloud Ct
- 2053 Malcolm St
- 2325 Wisteria St
- 2190 Magnolia St
- 1904 Heywood St Unit L
- 2461 Pinewood Place
- 1932 Heywood St Unit B
- 2343 Lupin St
- 2646 Prather St
- 2311 Marvel Ave
- 2239 E Brower St
- 2221 E Brower St
- 2243 E Brower St
- 2234 Burnside St
- 2222 Burnside St
- 2240 Burnside St
- 2257 E Brower St
- 2218 Burnside St
- 2252 Burnside St
- 2242 E Brower St
- 2238 E Brower St
- 2256 E Brower St
- 2220 E Brower St
- 2261 E Brower St
- 2266 Burnside St
- 2260 E Brower St
- 2216 E Brower St
- 2277 E Brower St
- 2011 N Justin Ave
- 2027 N Justin Ave
Ask me questions while you tour the home.