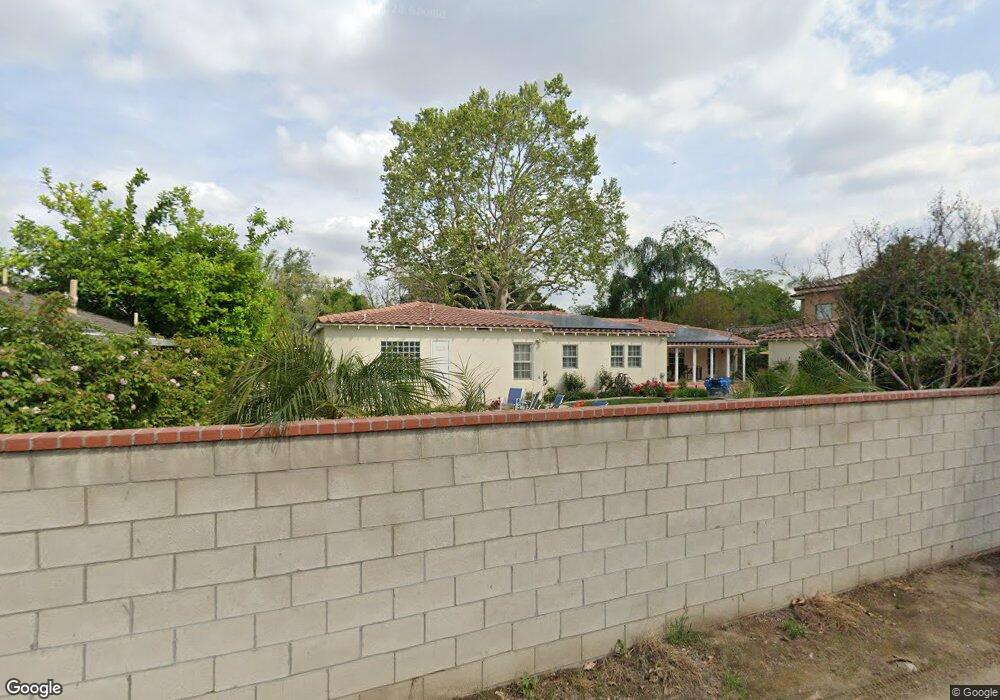
2223 Spruce St Bakersfield, CA 93301
Riviera/Westchester NeighborhoodEstimated Value: $537,000 - $693,000
2
Beds
1
Bath
1,647
Sq Ft
$370/Sq Ft
Est. Value
About This Home
This home is located at 2223 Spruce St, Bakersfield, CA 93301 and is currently estimated at $610,091, approximately $370 per square foot. 2223 Spruce St is a home located in Kern County with nearby schools including Franklin Elementary School, Emerson Middle School, and Bakersfield High School.
Ownership History
Date
Name
Owned For
Owner Type
Purchase Details
Closed on
Jan 18, 2010
Sold by
Meek George H and Meek Cynthia M
Bought by
Meek George H and Meek Cynthia M
Current Estimated Value
Purchase Details
Closed on
Mar 15, 2001
Sold by
Martin Herbert R and Martin Herbert R
Bought by
Meek George H and Meek Cynthia M
Home Financials for this Owner
Home Financials are based on the most recent Mortgage that was taken out on this home.
Original Mortgage
$240,000
Outstanding Balance
$87,064
Interest Rate
6.97%
Estimated Equity
$523,027
Create a Home Valuation Report for This Property
The Home Valuation Report is an in-depth analysis detailing your home's value as well as a comparison with similar homes in the area
Home Values in the Area
Average Home Value in this Area
Purchase History
| Date | Buyer | Sale Price | Title Company |
|---|---|---|---|
| Meek George H | -- | None Available | |
| Meek George H | $300,000 | American Title |
Source: Public Records
Mortgage History
| Date | Status | Borrower | Loan Amount |
|---|---|---|---|
| Open | Meek George H | $240,000 |
Source: Public Records
Tax History
| Year | Tax Paid | Tax Assessment Tax Assessment Total Assessment is a certain percentage of the fair market value that is determined by local assessors to be the total taxable value of land and additions on the property. | Land | Improvement |
|---|---|---|---|---|
| 2025 | $5,840 | $452,029 | $90,399 | $361,630 |
| 2024 | $5,726 | $443,167 | $88,627 | $354,540 |
| 2023 | $5,726 | $434,479 | $86,890 | $347,589 |
| 2022 | $5,619 | $425,961 | $85,187 | $340,774 |
| 2021 | $5,475 | $417,610 | $83,517 | $334,093 |
| 2020 | $5,432 | $413,329 | $82,661 | $330,668 |
| 2019 | $5,322 | $413,329 | $82,661 | $330,668 |
| 2018 | $5,192 | $397,281 | $79,452 | $317,829 |
| 2017 | $5,168 | $389,493 | $77,895 | $311,598 |
| 2016 | $4,687 | $381,857 | $76,368 | $305,489 |
| 2015 | $4,670 | $376,122 | $75,221 | $300,901 |
| 2014 | $3,891 | $313,000 | $78,000 | $235,000 |
Source: Public Records
Map
Nearby Homes
Your Personal Tour Guide
Ask me questions while you tour the home.