
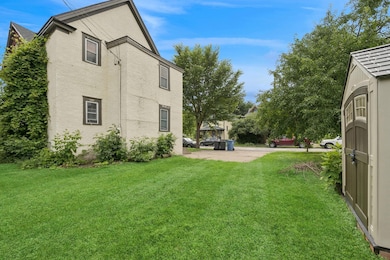
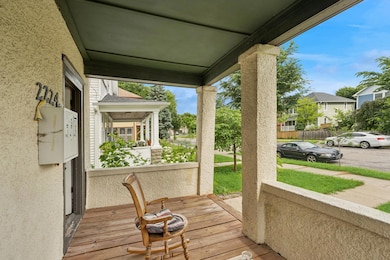
2224 4th Ave N Minneapolis, MN 55405
Harrison NeighborhoodEstimated payment $2,196/month
About This Home
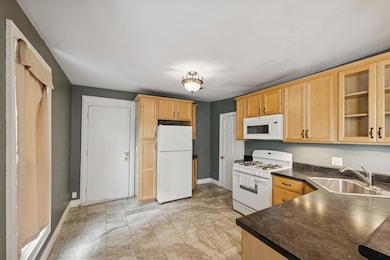
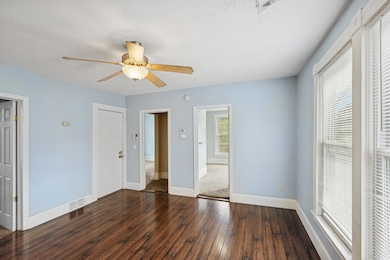
This property offers the ideal opportunity for those seeking the best of city living with the added benefit of rental income. Located in a vibrant neighborhood just minutes from downtown, close to Theodore Wirth Park with 759 acres of park lake and the local farmer's market.
Property Details
Home Type
- Multi-Family
Est. Annual Taxes
- $5,500
Year Built
- Built in 1900
Home Design
- Duplex
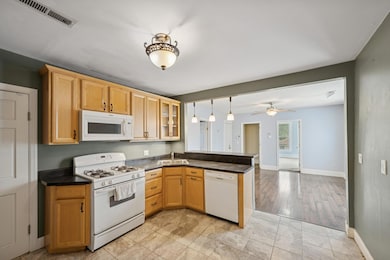
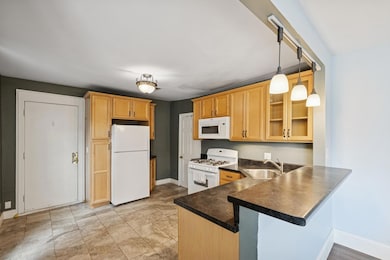
Interior Spaces
- 1,934 Sq Ft Home
- 2-Story Property
Bedrooms and Bathrooms
- 5 Bedrooms
- 2 Bathrooms
Basement
- Basement Fills Entire Space Under The House
- Block Basement Construction
Utilities
- Forced Air Heating System
Community Details
- 2 Units
Listing and Financial Details
- Assessor Parcel Number 2002924410106
Map
Home Values in the Area
Average Home Value in this Area
Tax History
| Year | Tax Paid | Tax Assessment Tax Assessment Total Assessment is a certain percentage of the fair market value that is determined by local assessors to be the total taxable value of land and additions on the property. | Land | Improvement |
|---|---|---|---|---|
| 2024 | $5,289 | $290,000 | $63,000 | $227,000 |
| 2023 | $4,463 | $279,000 | $67,000 | $212,000 |
| 2022 | $3,771 | $274,000 | $67,000 | $207,000 |
| 2021 | $3,137 | $222,000 | $21,000 | $201,000 |
| 2020 | $3,394 | $192,000 | $12,200 | $179,800 |
| 2019 | $3,167 | $192,000 | $8,100 | $183,900 |
| 2018 | $2,686 | $174,500 | $8,100 | $166,400 |
| 2017 | $2,502 | $133,500 | $7,400 | $126,100 |
| 2016 | $2,243 | $116,000 | $7,400 | $108,600 |
| 2015 | $1,695 | $124,000 | $7,400 | $116,600 |
| 2014 | -- | $108,000 | $7,400 | $100,600 |
Property History
| Date | Event | Price | List to Sale | Price per Sq Ft |
|---|---|---|---|---|
| 10/23/2025 10/23/25 | Price Changed | $330,000 | -2.9% | $171 / Sq Ft |
| 10/07/2025 10/07/25 | Price Changed | $340,000 | -2.9% | $176 / Sq Ft |
| 07/07/2025 07/07/25 | For Sale | $350,000 | -- | $181 / Sq Ft |
Purchase History
| Date | Type | Sale Price | Title Company |
|---|---|---|---|
| Deed | $322,000 | -- | |
| Warranty Deed | $142,100 | Home Title Inc | |
| Foreclosure Deed | $60,000 | -- | |
| Warranty Deed | $250,000 | -- | |
| Warranty Deed | $51,500 | -- |
Mortgage History
| Date | Status | Loan Amount | Loan Type |
|---|---|---|---|
| Open | $257,000 | New Conventional |
Source: NorthstarMLS
MLS Number: 6739435
APN: 20-029-24-41-0106
Disclaimer: Certain information contained herein is derived from information provided by parties other than Homes.com. All information provided is deemed reliable, but is not guaranteed to be accurate and should be independently verified.
![]() Based on information submitted to the MLS GRID. All data is obtained from various sources and may not have been verified by broker or MLS GRID. Supplied Open House Information is subject to change without notice. All information should be independently reviewed and verified for accuracy. Properties may or may not be listed by the office/agent presenting the information. Some IDX listings have been excluded from this website.
Based on information submitted to the MLS GRID. All data is obtained from various sources and may not have been verified by broker or MLS GRID. Supplied Open House Information is subject to change without notice. All information should be independently reviewed and verified for accuracy. Properties may or may not be listed by the office/agent presenting the information. Some IDX listings have been excluded from this website.
The Digital Millennium Copyright Act of 1998, 17 U.S.C. § 512 (the “DMCA”) provides recourse for copyright owners who believe that material appearing on the Internet infringes their rights under U.S. copyright law. If you believe in good faith that any content or material made available in connection with our website or services infringes your copyright, you (or your agent) may send us a notice requesting that the content or material be removed, or access to it blocked.
Notices must be sent in writing by email to DMCAnotice@MLSGrid.com.
The DMCA requires that your notice of alleged copyright infringement include the following information:
(1) description of the copyrighted work that is the subject of claimed infringement;
(2) description of the alleged infringing content and information sufficient to permit us to locate the content;
(3) contact information for you, including your address, telephone number and email address;
(4) a statement by you that you have a good faith belief that the content in the manner complained of is not authorized by the copyright owner, or its agent, or by the operation of any law;
(5) a statement by you, signed under penalty of perjury, that the information in the notification is accurate and that you have the authority to enforce the copyrights that are claimed to be infringed; and
(6) a physical or electronic signature of the copyright owner or a person authorized to act on the copyright owner’s behalf. Failure to include all of the above information may result in the delay of the processing of your complaint.
- 615 Russell Ave N
- 617 Morgan Ave N
- 248 Morgan Ave N
- 811 Queen Ave N
- 722 Newton Ave N
- 8 Queen Ave S
- 1718 3rd Ave N
- 1723 3rd Ave N
- 819 Sheridan Ave N
- 905 Queen Ave N
- 918 Queen Ave N
- 37 Queen Ave S
- 40 Penn Ave S
- 226 Gramercy Ave
- 209 Cedar Lake Rd N
- 212 Cedar Lake Rd S
- 20 Vincent Ave S
- 250 Irving Ave N
- 1214 Penn Ave N
- 1028 Knox Ave N
- 621 Morgan Ave N Unit 1
- 903 Sheridan Ave N Unit Upper Unit
- 910 Oliver Ave N Unit 1
- 910 Oliver Ave N Unit 3
- 1618 Thomas Place N Unit 2
- 716 Elwood Ave N
- 716 Elwood Ave N Unit Upper Level Unit
- 1315 Olson Memorial Hwy
- 265 Girard Ave N
- 560 Humboldt Ave N
- 1207 Glenwood Ave
- 1115 Humboldt Ave N
- 2800 N Wayzata Blvd
- 2850 N Wayzata Blvd
- 2840 Wayzata Blvd
- 2823 Wayzata Blvd
- 290 Market St Unit 702
- 311 Kenwood Pkwy
- 48 Groveland Terrace Unit B103
- 1800 Fremont Ave N
