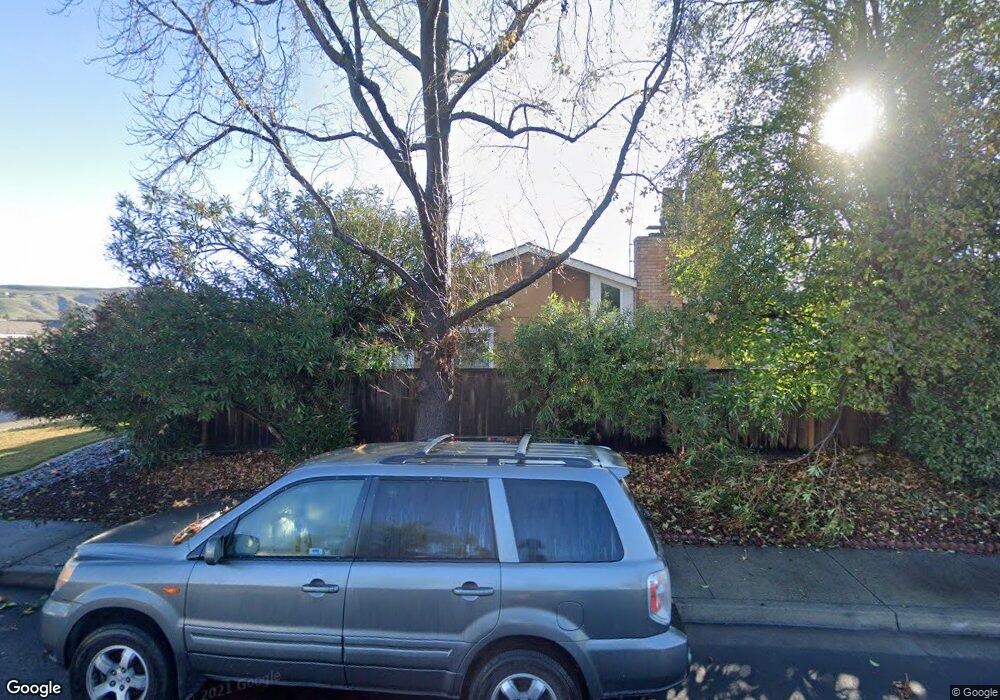
2224 Grouse Way Union City, CA 94587
Downtown Union City NeighborhoodEstimated Value: $1,049,000 - $1,251,000
3
Beds
2
Baths
1,167
Sq Ft
$1,006/Sq Ft
Est. Value
About This Home
This home is located at 2224 Grouse Way, Union City, CA 94587 and is currently estimated at $1,174,372, approximately $1,006 per square foot. 2224 Grouse Way is a home located in Alameda County with nearby schools including Guy Jr. Emanuele Elementary School, Cesar Chavez Middle School, and James Logan High School.
Ownership History
Date
Name
Owned For
Owner Type
Purchase Details
Closed on
Jul 5, 2012
Sold by
U S Bank National Association
Bought by
Jiangkai Chen Dds Defined Benefit Plan
Current Estimated Value
Purchase Details
Closed on
Jun 26, 2012
Sold by
U S Bank National Association
Bought by
Jiangkai Chen Dds Defined Benefit Plan
Purchase Details
Closed on
Jan 27, 2012
Sold by
Sun Kim Paul Ki and Sun Yi Hea
Bought by
U S Bank National Association
Purchase Details
Closed on
Sep 11, 2001
Sold by
Gupta Rajesh and Gupta Amita
Bought by
Sun Kim Paul Ki and Sun Yi Hea
Home Financials for this Owner
Home Financials are based on the most recent Mortgage that was taken out on this home.
Original Mortgage
$322,200
Interest Rate
7.37%
Create a Home Valuation Report for This Property
The Home Valuation Report is an in-depth analysis detailing your home's value as well as a comparison with similar homes in the area
Home Values in the Area
Average Home Value in this Area
Purchase History
| Date | Buyer | Sale Price | Title Company |
|---|---|---|---|
| Jiangkai Chen Dds Defined Benefit Plan | $360,000 | Chicago Title Company | |
| Jiangkai Chen Dds Defined Benefit Plan | $360,000 | Chicago Title Company | |
| U S Bank National Association | $268,380 | Service Link | |
| Sun Kim Paul Ki | $358,000 | Chicago Title Co |
Source: Public Records
Mortgage History
| Date | Status | Borrower | Loan Amount |
|---|---|---|---|
| Previous Owner | Sun Kim Paul Ki | $322,200 |
Source: Public Records
Tax History Compared to Growth
Tax History
| Year | Tax Paid | Tax Assessment Tax Assessment Total Assessment is a certain percentage of the fair market value that is determined by local assessors to be the total taxable value of land and additions on the property. | Land | Improvement |
|---|---|---|---|---|
| 2025 | $7,095 | $452,155 | $135,646 | $316,509 |
| 2024 | $7,095 | $443,292 | $132,987 | $310,305 |
| 2023 | $6,842 | $434,601 | $130,380 | $304,221 |
| 2022 | $6,709 | $426,081 | $127,824 | $298,257 |
| 2021 | $6,560 | $417,728 | $125,318 | $292,410 |
| 2020 | $6,450 | $413,448 | $124,034 | $289,414 |
| 2019 | $6,503 | $405,344 | $121,603 | $283,741 |
| 2018 | $6,351 | $397,400 | $119,220 | $278,180 |
| 2017 | $6,199 | $389,610 | $116,883 | $272,727 |
| 2016 | $5,977 | $381,970 | $114,591 | $267,379 |
| 2015 | $5,861 | $376,235 | $112,870 | $263,365 |
| 2014 | $5,643 | $368,866 | $110,660 | $258,206 |
Source: Public Records
Map
Nearby Homes
- 34926 Osprey Dr
- 35560 Monterra Terrace Unit 301
- 2224 Peacock Place Unit 3
- 2221 Partridge Way Unit 3
- 1157 Silver St
- 1027 Chalcedony Terrace
- 2404 Maraschino Place
- 409 King Ave
- 35180 Mount Whitney Terrace
- 34926 Moina Shaiq Common
- 3134 Warwick Rd
- 33852 11th St
- 126 Bellflower Ln
- 315 Springstone Dr
- 35784 Linda Dr
- 213 Ladera Plaza Unit 13
- 138 Donoso Plaza
- 34237 Torrey Pine Ln
- 3155 Mackenzie Place
- 217 Appian Way
- 2244 Grouse Way
- 2220 Grouse Way
- 2216 Grouse Way
- 2254 Grouse Way
- 2271 Grouse Way
- 2239 Grouse Way
- 2223 Grouse Way
- 2235 Grouse Way
- 2275 Grouse Way
- 2243 Grouse Way
- 2215 Grouse Way
- 2231 Grouse Way
- 2212 Grouse Way
- 2227 Grouse Way
- 2247 Grouse Way
- 2279 Grouse Way
- 2211 Grouse Way
- 2248 Tanger Ct
- 2208 Grouse Way
- 2251 Grouse Way