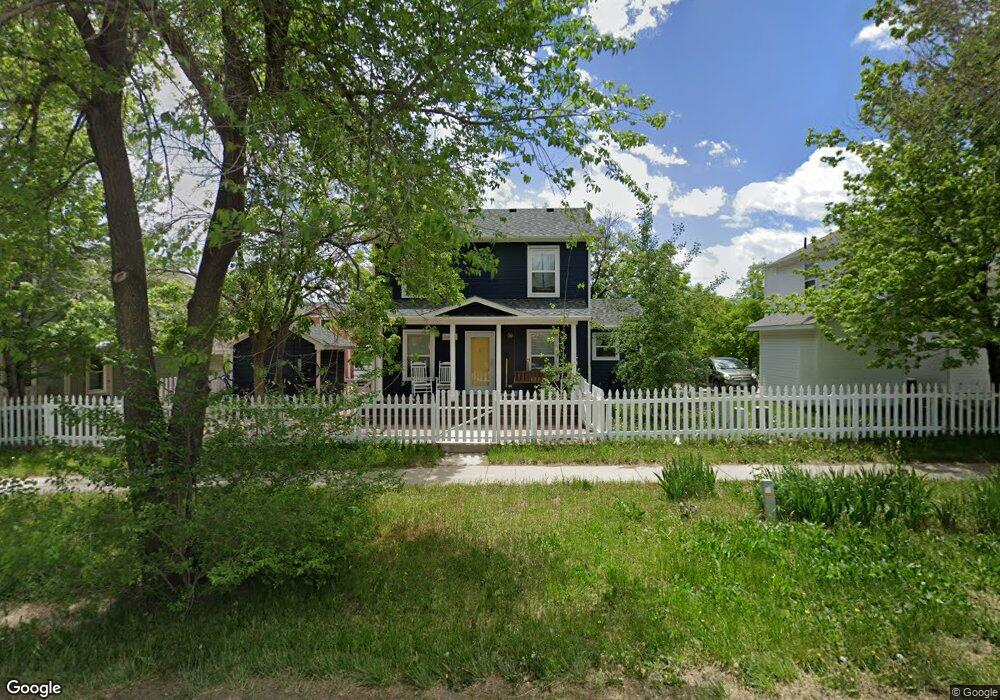
2224 Violet Ave Boulder, CO 80304
North Boulder NeighborhoodEstimated Value: $383,000 - $1,103,000
4
Beds
2
Baths
1,264
Sq Ft
$498/Sq Ft
Est. Value
About This Home
This home is located at 2224 Violet Ave, Boulder, CO 80304 and is currently estimated at $628,981, approximately $497 per square foot. 2224 Violet Ave is a home located in Boulder County with nearby schools including Crest View Elementary School, Centennial Middle School, and Boulder High School.
Ownership History
Date
Name
Owned For
Owner Type
Purchase Details
Closed on
Feb 24, 2006
Sold by
Shekanena Samuel
Bought by
Malmberg Jason E
Current Estimated Value
Home Financials for this Owner
Home Financials are based on the most recent Mortgage that was taken out on this home.
Original Mortgage
$123,716
Outstanding Balance
$69,588
Interest Rate
6.09%
Mortgage Type
FHA
Estimated Equity
$559,393
Purchase Details
Closed on
Feb 28, 2005
Sold by
Shekanena Sala and Shekanena Samuel
Bought by
Shekanena Samuel
Purchase Details
Closed on
Apr 28, 1999
Sold by
Habitat For Humanity Of Boulder Vly Inc
Bought by
Shekanena Samuel R
Home Financials for this Owner
Home Financials are based on the most recent Mortgage that was taken out on this home.
Original Mortgage
$102,385
Interest Rate
7.07%
Mortgage Type
Seller Take Back
Create a Home Valuation Report for This Property
The Home Valuation Report is an in-depth analysis detailing your home's value as well as a comparison with similar homes in the area
Home Values in the Area
Average Home Value in this Area
Purchase History
| Date | Buyer | Sale Price | Title Company |
|---|---|---|---|
| Malmberg Jason E | $124,822 | Guardian Title Agency | |
| Shekanena Samuel | -- | -- | |
| Shekanena Samuel R | $104,522 | -- |
Source: Public Records
Mortgage History
| Date | Status | Borrower | Loan Amount |
|---|---|---|---|
| Open | Malmberg Jason E | $123,716 | |
| Previous Owner | Shekanena Samuel R | $102,385 | |
| Closed | Shekanena Samuel R | $2,500 |
Source: Public Records
Tax History
| Year | Tax Paid | Tax Assessment Tax Assessment Total Assessment is a certain percentage of the fair market value that is determined by local assessors to be the total taxable value of land and additions on the property. | Land | Improvement |
|---|---|---|---|---|
| 2025 | $651 | $11,472 | $5,736 | $5,736 |
| 2024 | $651 | $11,472 | $5,736 | $5,736 |
| 2023 | $640 | $7,413 | $5,549 | $5,549 |
| 2022 | $1,038 | $11,176 | $5,588 | $5,588 |
| 2021 | $990 | $11,498 | $5,749 | $5,749 |
| 2020 | $963 | $11,068 | $5,534 | $5,534 |
| 2019 | $949 | $11,068 | $5,534 | $5,534 |
| 2018 | $929 | $10,714 | $5,357 | $5,357 |
| 2017 | $900 | $11,844 | $5,922 | $5,922 |
| 2016 | $988 | $11,414 | $5,707 | $5,707 |
| 2015 | $936 | $11,128 | $5,564 | $5,564 |
| 2014 | $936 | $11,128 | $5,564 | $5,564 |
Source: Public Records
Map
Nearby Homes
- 2155 Vine Ave
- 2170 Vine Ave
- 2190 Vine Ave
- 2125 Vine Ave
- 2116 Vine Ave
- 2126 Vine Ave
- 2362 Spotswood Place
- 2158 Tamarack Ave
- 4500 19th St Unit 111
- 4500 19th St
- 4500 19th St Unit 178
- 1800 Sumac Ave
- 2770 Arbor Glen Place
- 1801 Redwood Ave
- 4621 18th St Unit B6
- 1820 Mary Ln Unit B16
- 1707 Yarmouth Ave Unit 108
- 2558 Premier Place
- 1560 Sumac Ave
- 4625 15th St Unit D
- 2202 Violet Ave
- 2236 Violet Ave
- 4373 Vineyard Ln
- 4375 Vineyard Ln
- 4355 Vineyard Ln
- 2248 Violet Ave
- 4339 Vineyard Ln
- 4358 Vineyard Ln
- 4351 Vineyard Ln
- 4333 Vineyard Ln
- 2277 Vineyard Place
- 4350 Vineyard Ln
- 4336 Vineyard Ln
- 4342 Vineyard Ln
- 4330 Vineyard Ln
- 2295 Vineyard Place
- 4348 Vineyard Ln
- 2165 Vine Ave
- 2280 Vineyard Place
- 0 Vine (2 2) Ave Unit 4369450
Your Personal Tour Guide
Ask me questions while you tour the home.