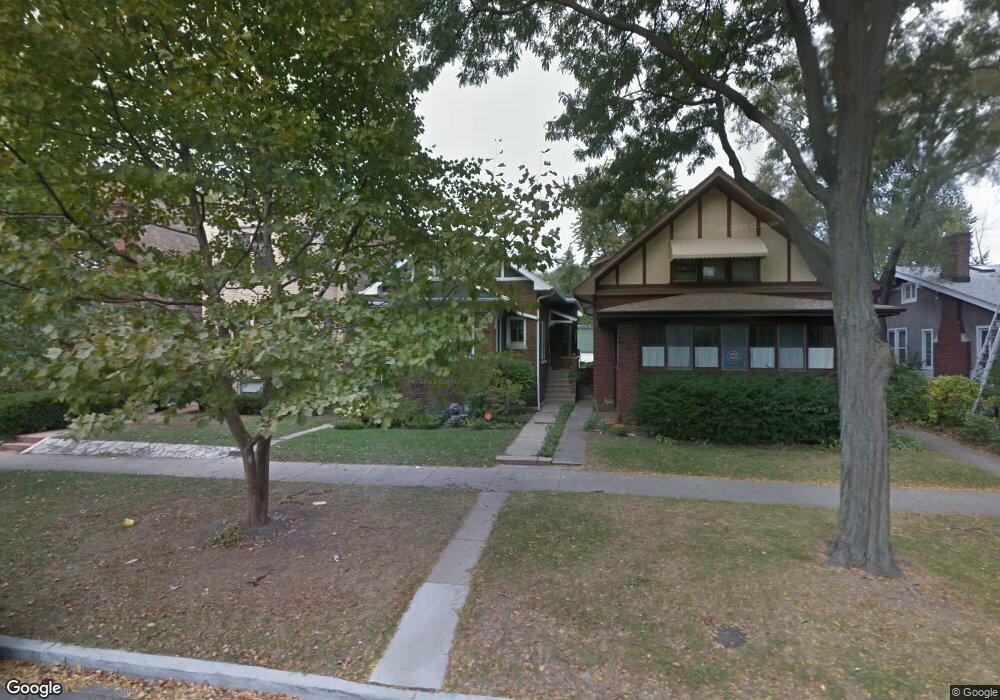
2226 W Estes Ave Chicago, IL 60645
West Ridge NeighborhoodEstimated Value: $496,000 - $677,000
4
Beds
2
Baths
1,273
Sq Ft
$458/Sq Ft
Est. Value
About This Home
This home is located at 2226 W Estes Ave, Chicago, IL 60645 and is currently estimated at $582,981, approximately $457 per square foot. 2226 W Estes Ave is a home located in Cook County with nearby schools including George Armstrong Elementary School, Sullivan High School, and Acero - Sor Juana Ines de la Cruz School.
Ownership History
Date
Name
Owned For
Owner Type
Purchase Details
Closed on
Aug 18, 2021
Sold by
Danielson Zachary P and Danielson Katherine A
Bought by
Danielson Zachary P and Danielson Katherine A
Current Estimated Value
Purchase Details
Closed on
Jul 31, 2009
Sold by
Ferguson Diana
Bought by
Danielson Zachary P and Danielson Katherine A
Home Financials for this Owner
Home Financials are based on the most recent Mortgage that was taken out on this home.
Original Mortgage
$320,095
Outstanding Balance
$209,448
Interest Rate
5.28%
Mortgage Type
FHA
Estimated Equity
$373,533
Purchase Details
Closed on
Oct 4, 2002
Sold by
Brennan Mary L
Bought by
Ferguson Diana S
Home Financials for this Owner
Home Financials are based on the most recent Mortgage that was taken out on this home.
Original Mortgage
$162,500
Interest Rate
4.75%
Create a Home Valuation Report for This Property
The Home Valuation Report is an in-depth analysis detailing your home's value as well as a comparison with similar homes in the area
Home Values in the Area
Average Home Value in this Area
Purchase History
| Date | Buyer | Sale Price | Title Company |
|---|---|---|---|
| Danielson Zachary P | -- | Attorney | |
| Danielson Zachary P | $326,000 | Chicago Title Insurance Co | |
| Ferguson Diana S | $312,500 | -- |
Source: Public Records
Mortgage History
| Date | Status | Borrower | Loan Amount |
|---|---|---|---|
| Open | Danielson Zachary P | $320,095 | |
| Previous Owner | Ferguson Diana S | $162,500 |
Source: Public Records
Tax History Compared to Growth
Tax History
| Year | Tax Paid | Tax Assessment Tax Assessment Total Assessment is a certain percentage of the fair market value that is determined by local assessors to be the total taxable value of land and additions on the property. | Land | Improvement |
|---|---|---|---|---|
| 2024 | $6,896 | $44,000 | $10,800 | $33,200 |
| 2023 | $6,701 | $38,426 | $8,640 | $29,786 |
| 2022 | $6,701 | $38,426 | $8,640 | $29,786 |
| 2021 | $6,570 | $36,000 | $8,640 | $27,360 |
| 2020 | $5,070 | $25,863 | $8,160 | $17,703 |
| 2019 | $5,072 | $28,673 | $8,160 | $20,513 |
| 2018 | $4,985 | $28,673 | $8,160 | $20,513 |
| 2017 | $4,793 | $25,642 | $7,200 | $18,442 |
| 2016 | $4,636 | $25,642 | $7,200 | $18,442 |
| 2015 | $4,218 | $25,642 | $7,200 | $18,442 |
| 2014 | $4,010 | $24,183 | $6,720 | $17,463 |
| 2013 | $3,920 | $24,183 | $6,720 | $17,463 |
Source: Public Records
Map
Nearby Homes
- 7129 N Oakley Ave
- 2175 W Touhy Ave
- 2224 W Touhy Ave Unit 3N
- 7223 N Oakley Ave Unit 1E
- 7234 N Hamilton Ave
- 7252 N Bell Ave
- 2101 W Greenleaf Ave
- 7074 N Ridge Blvd Unit 1E
- 7315 N Oakley Ave Unit 1A
- 7070 N Ridge Blvd Unit 1A
- 2424 W Estes Ave Unit 1C
- 2424 W Estes Ave Unit 3B
- 6961 N Oakley Ave Unit 210
- 7228 N Rogers Ave
- 7344 N Ridge Blvd Unit 5C
- 7348 N Ridge Blvd Unit 16B
- 7249 N Campbell Ave Unit B
- 2109 W Jarvis Ave Unit 1
- 7019 N Ridge Blvd Unit 3B
- 7019 N Ridge Blvd Unit 3A
- 2228 W Estes Ave
- 2222 W Estes Ave
- 2232 W Estes Ave Unit 1
- 2218 W Estes Ave
- 2236 W Estes Ave
- 2214 W Estes Ave
- 2240 W Estes Ave
- 2210 W Estes Ave
- 2244 W Estes Ave
- 2233 W Touhy Ave
- 2204 W Estes Ave
- 2219 W Estes Ave Unit 1
- 2248 W Estes Ave
- 2235 W Touhy Ave
- 2229 W Touhy Ave
- 2239 W Touhy Ave
- 2225 W Touhy Ave Unit 1
- 2217 W Touhy Ave
- 2217 W Touhy Ave
- 2221 W Touhy Ave