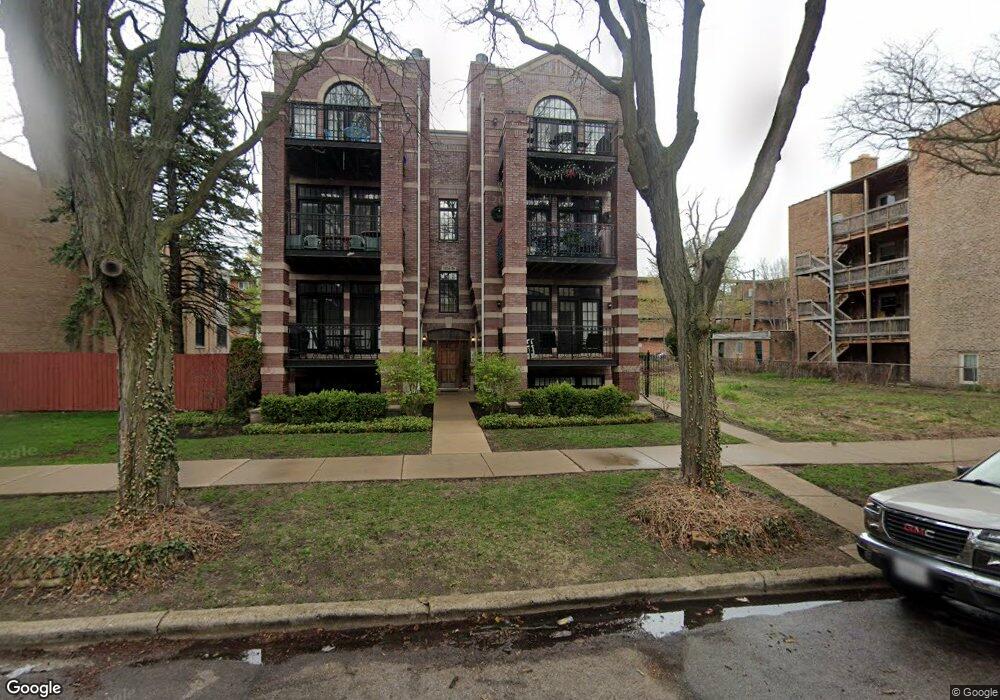
2226 W Morse Ave Unit 3W Chicago, IL 60645
West Ridge NeighborhoodEstimated Value: $239,000 - $358,000
--
Bed
--
Bath
12,492
Sq Ft
$23/Sq Ft
Est. Value
About This Home
This home is located at 2226 W Morse Ave Unit 3W, Chicago, IL 60645 and is currently estimated at $284,196, approximately $22 per square foot. 2226 W Morse Ave Unit 3W is a home located in Cook County with nearby schools including George Armstrong Elementary School, Sullivan High School, and God's Battle Axe Prayer Academy.
Ownership History
Date
Name
Owned For
Owner Type
Purchase Details
Closed on
Dec 15, 2015
Sold by
Nyamweya Onserio and Nyamweya Pippa
Bought by
Christensen Michael and Lancki Nicola
Current Estimated Value
Home Financials for this Owner
Home Financials are based on the most recent Mortgage that was taken out on this home.
Original Mortgage
$195,700
Outstanding Balance
$156,698
Interest Rate
4.25%
Mortgage Type
New Conventional
Estimated Equity
$127,498
Purchase Details
Closed on
Aug 3, 2009
Sold by
Nyamweya Onserio and Nyamweya Pippa
Bought by
Pippe Nyamweya Onserio and Pippe Nyamweya
Home Financials for this Owner
Home Financials are based on the most recent Mortgage that was taken out on this home.
Original Mortgage
$200,000
Interest Rate
5.38%
Mortgage Type
New Conventional
Purchase Details
Closed on
Mar 28, 2005
Sold by
Bcj Development Llc
Bought by
Nyamweya Onserio and Flanigan Pippa
Home Financials for this Owner
Home Financials are based on the most recent Mortgage that was taken out on this home.
Original Mortgage
$219,100
Interest Rate
5.12%
Mortgage Type
New Conventional
Create a Home Valuation Report for This Property
The Home Valuation Report is an in-depth analysis detailing your home's value as well as a comparison with similar homes in the area
Home Values in the Area
Average Home Value in this Area
Purchase History
| Date | Buyer | Sale Price | Title Company |
|---|---|---|---|
| Christensen Michael | $206,000 | Fidelity National Title | |
| Pippe Nyamweya Onserio | -- | First American Title Ins Co | |
| Nyamweya Onserio | $313,000 | Multiple |
Source: Public Records
Mortgage History
| Date | Status | Borrower | Loan Amount |
|---|---|---|---|
| Open | Christensen Michael | $195,700 | |
| Previous Owner | Pippe Nyamweya Onserio | $200,000 | |
| Previous Owner | Nyamweya Onserio | $219,100 | |
| Closed | Nyamweya Onserio | $31,300 |
Source: Public Records
Tax History Compared to Growth
Tax History
| Year | Tax Paid | Tax Assessment Tax Assessment Total Assessment is a certain percentage of the fair market value that is determined by local assessors to be the total taxable value of land and additions on the property. | Land | Improvement |
|---|---|---|---|---|
| 2024 | $2,887 | $27,343 | $2,154 | $25,189 |
| 2023 | $2,793 | $17,000 | $1,723 | $15,277 |
| 2022 | $2,793 | $17,000 | $1,723 | $15,277 |
| 2021 | $2,749 | $16,999 | $1,722 | $15,277 |
| 2020 | $3,204 | $17,483 | $1,627 | $15,856 |
| 2019 | $3,208 | $19,394 | $1,627 | $17,767 |
| 2018 | $3,152 | $19,394 | $1,627 | $17,767 |
| 2017 | $2,979 | $17,215 | $1,435 | $15,780 |
| 2016 | $2,948 | $17,215 | $1,435 | $15,780 |
| 2015 | $2,674 | $17,215 | $1,435 | $15,780 |
| 2014 | $2,184 | $14,339 | $1,292 | $13,047 |
| 2013 | $2,130 | $14,339 | $1,292 | $13,047 |
Source: Public Records
Map
Nearby Homes
- 2302 W Farwell Ave Unit 1
- 2300 W Farwell Ave Unit 3
- 2300 W Farwell Ave Unit 2
- 2245 W Farwell Ave Unit 3B
- 6827 N Oakley Ave Unit 3C
- 2241 W Farwell Ave Unit 2D
- 2243 W Farwell Ave Unit 3D
- 6960 N Bell Ave Unit 208
- 2217 W Farwell Ave Unit 3B
- 2217 W Farwell Ave Unit 2B
- 2322 W Farwell Ave Unit 1W
- 2130 W Farwell Ave
- 2416 W Morse Ave
- 6957 N Hamilton Ave
- 2065 W Farwell Ave Unit 20653N
- 2036 W Morse Ave Unit D
- 2101 W Greenleaf Ave
- 2509 W Morse Ave
- 2006 W Farwell Ave
- 2424 W Estes Ave Unit 1C
- 2226 W Morse Ave Unit 2E
- 2226 W Morse Ave Unit 1W
- 2226 W Morse Ave Unit 1
- 2226 W Morse Ave Unit 3E
- 2228 W Morse Ave Unit 3E
- 2228 W Morse Ave Unit 1E
- 2228 W Morse Ave Unit 2W
- 2228 W Morse Ave Unit 3W
- 2220 W Morse Ave
- 2234 W Morse Ave
- 2248 W Morse Ave Unit G
- 2248 W Morse Ave Unit 1
- 2248 W Morse Ave Unit 2
- 2242 W Morse Ave Unit 1
- 2242 W Morse Ave Unit 3
- 2236 W Morse Ave Unit 1
- 2216 W Morse Ave Unit 2
- 2216 W Morse Ave
- 2210 W Morse Ave
- 2210 W Morse Ave Unit 1