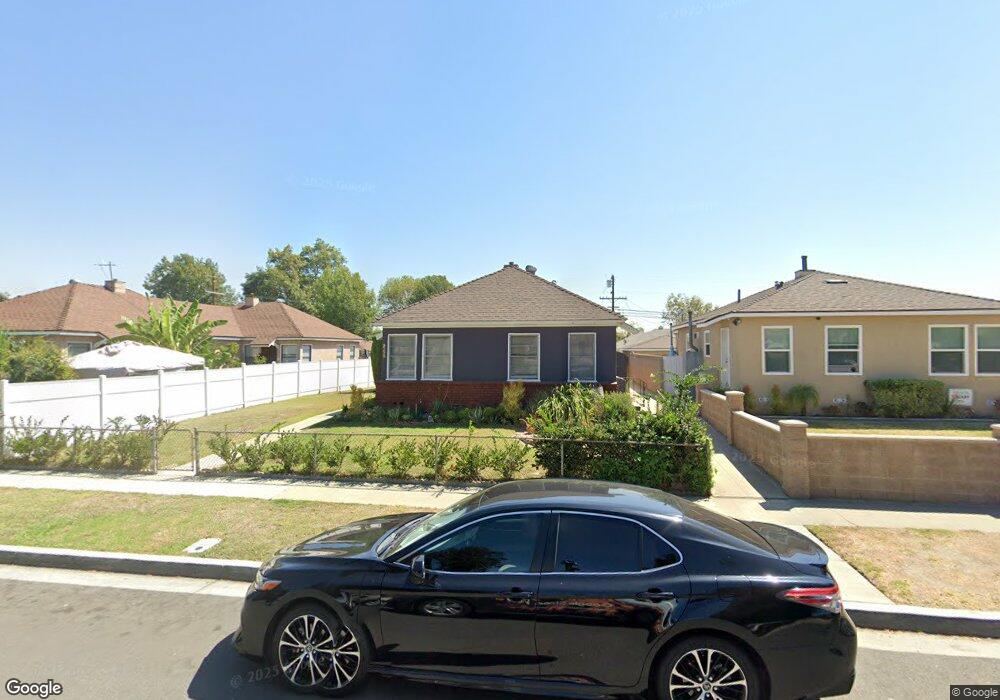
2228 Euclid Ave Long Beach, CA 90815
Artcraft Manor NeighborhoodEstimated Value: $987,959 - $1,115,000
4
Beds
2
Baths
1,788
Sq Ft
$601/Sq Ft
Est. Value
About This Home
This home is located at 2228 Euclid Ave, Long Beach, CA 90815 and is currently estimated at $1,074,990, approximately $601 per square foot. 2228 Euclid Ave is a home located in Los Angeles County with nearby schools including Bixby Elementary School, Stanford Middle School, and Woodrow Wilson High School.
Ownership History
Date
Name
Owned For
Owner Type
Purchase Details
Closed on
May 10, 2024
Sold by
Thompson Tambera Deon
Bought by
Tambera Thompson Living Trust and Thompson
Current Estimated Value
Purchase Details
Closed on
Mar 15, 2001
Sold by
Ketcham Christopher F
Bought by
Thompson Tambera Deon
Home Financials for this Owner
Home Financials are based on the most recent Mortgage that was taken out on this home.
Original Mortgage
$236,342
Interest Rate
6.92%
Mortgage Type
FHA
Purchase Details
Closed on
Feb 5, 1997
Sold by
Ketcham Rodney I
Bought by
Ketcham Christopher F and Ketcham Wendy P
Create a Home Valuation Report for This Property
The Home Valuation Report is an in-depth analysis detailing your home's value as well as a comparison with similar homes in the area
Home Values in the Area
Average Home Value in this Area
Purchase History
| Date | Buyer | Sale Price | Title Company |
|---|---|---|---|
| Tambera Thompson Living Trust | -- | None Listed On Document | |
| Thompson Tambera Deon | $240,000 | Fidelity Title | |
| Ketcham Christopher F | -- | North American Title Co | |
| Ketcham Christopher F | -- | North American Title Co |
Source: Public Records
Mortgage History
| Date | Status | Borrower | Loan Amount |
|---|---|---|---|
| Previous Owner | Thompson Tambera Deon | $236,342 |
Source: Public Records
Tax History
| Year | Tax Paid | Tax Assessment Tax Assessment Total Assessment is a certain percentage of the fair market value that is determined by local assessors to be the total taxable value of land and additions on the property. | Land | Improvement |
|---|---|---|---|---|
| 2025 | $5,196 | $390,392 | $245,605 | $144,787 |
| 2024 | $5,196 | $382,739 | $240,790 | $141,949 |
| 2023 | $5,107 | $375,235 | $236,069 | $139,166 |
| 2022 | $4,804 | $367,879 | $231,441 | $136,438 |
| 2021 | $4,700 | $360,666 | $226,903 | $133,763 |
| 2019 | $4,632 | $349,971 | $220,174 | $129,797 |
| 2018 | $4,411 | $343,109 | $215,857 | $127,252 |
| 2016 | $4,052 | $329,787 | $207,476 | $122,311 |
| 2015 | $3,892 | $324,834 | $204,360 | $120,474 |
| 2014 | $3,871 | $318,472 | $200,357 | $118,115 |
Source: Public Records
Map
Nearby Homes
- 2155 Euclid Ave
- 2151 Euclid Ave
- 3950 E De Ora Way
- 3408 Hathaway Ave
- 3464 Hathaway Ave Unit 335
- 3488 Hathaway Ave
- 4201 E Jacinto Way
- 2501 Belmont Ave
- 2510 Termino Ave
- 3247 E Grant St
- 2108 Ridgeview Terrace Dr
- 3527 E Pacific Coast Hwy
- 2119 Ridgeview Terrace Dr
- 1725 Loma Ave Unit 18
- 1725 Loma Ave Unit 16
- 3700 E 17th St
- 2400 Quincy Ave
- 3401 E Wilton St Unit 306
- 3401 E Wilton St Unit 307
- 1730 Obispo Ave
- 2232 Euclid Ave
- 2224 Euclid Ave
- 2236 Euclid Ave
- 2220 Euclid Ave
- 2229 Grand Ave
- 2240 Euclid Ave
- 2216 Euclid Ave
- 2233 Grand Ave
- 2225 Grand Ave
- 2237 Grand Ave
- 2221 Grand Ave
- 2229 Euclid Ave
- 2233 Euclid Ave
- 2225 Euclid Ave
- 2244 Euclid Ave
- 2212 Euclid Ave
- 2219 Grand Ave
- 2241 Grand Ave
- 2237 Euclid Ave
- 2221 Euclid Ave
Your Personal Tour Guide
Ask me questions while you tour the home.