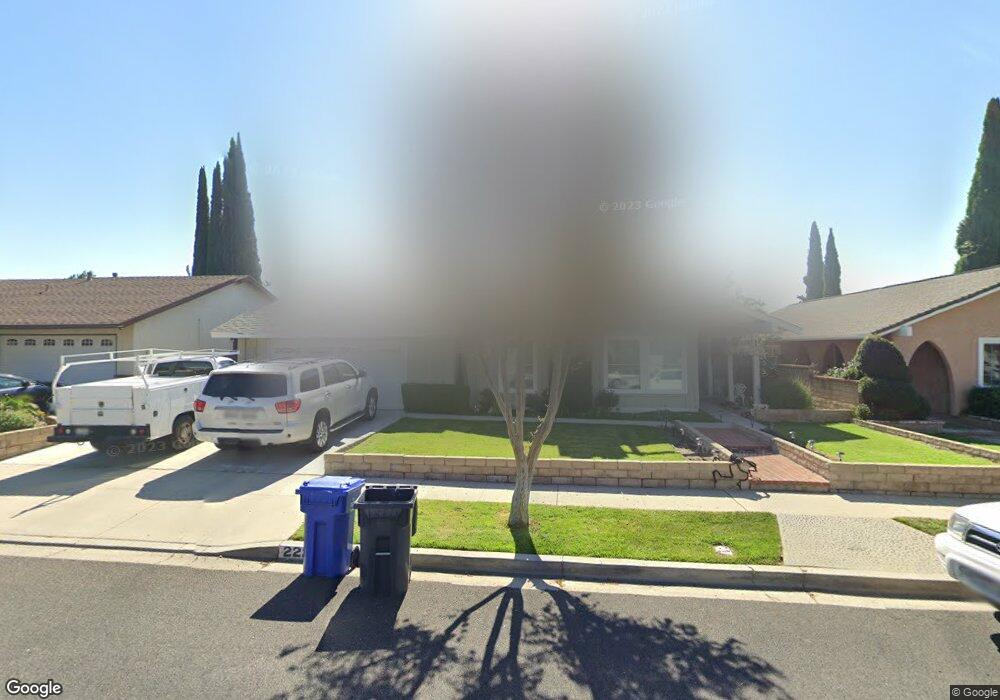
2228 Knollhaven St Simi Valley, CA 93065
Central Simi Valley NeighborhoodEstimated Value: $833,189 - $898,000
4
Beds
2
Baths
1,905
Sq Ft
$457/Sq Ft
Est. Value
About This Home
This home is located at 2228 Knollhaven St, Simi Valley, CA 93065 and is currently estimated at $870,547, approximately $456 per square foot. 2228 Knollhaven St is a home located in Ventura County with nearby schools including Park View Elementary School, Hillside Middle School, and Royal High School.
Ownership History
Date
Name
Owned For
Owner Type
Purchase Details
Closed on
Jan 22, 2016
Sold by
Garcia Jinell Marie and Kuhle Jinell M
Bought by
Garcia Mark Patrick and Garcia Jinell Marie
Current Estimated Value
Home Financials for this Owner
Home Financials are based on the most recent Mortgage that was taken out on this home.
Original Mortgage
$120,000
Outstanding Balance
$93,976
Interest Rate
3.5%
Mortgage Type
Adjustable Rate Mortgage/ARM
Estimated Equity
$776,571
Purchase Details
Closed on
Sep 24, 2007
Sold by
Kuhle James E
Bought by
Kuhle Jinell M
Purchase Details
Closed on
Jul 6, 1994
Sold by
Gutgsell Jeffery L
Bought by
Kuhle James E and Kuhle Jinell M
Home Financials for this Owner
Home Financials are based on the most recent Mortgage that was taken out on this home.
Original Mortgage
$173,400
Interest Rate
4%
Create a Home Valuation Report for This Property
The Home Valuation Report is an in-depth analysis detailing your home's value as well as a comparison with similar homes in the area
Home Values in the Area
Average Home Value in this Area
Purchase History
| Date | Buyer | Sale Price | Title Company |
|---|---|---|---|
| Garcia Mark Patrick | -- | Wfg National Title Co Of Ca | |
| Kuhle Jinell M | -- | None Available | |
| Kuhle James E | $204,000 | Gateway Title Co |
Source: Public Records
Mortgage History
| Date | Status | Borrower | Loan Amount |
|---|---|---|---|
| Open | Garcia Mark Patrick | $120,000 | |
| Closed | Kuhle James E | $173,400 |
Source: Public Records
Tax History Compared to Growth
Tax History
| Year | Tax Paid | Tax Assessment Tax Assessment Total Assessment is a certain percentage of the fair market value that is determined by local assessors to be the total taxable value of land and additions on the property. | Land | Improvement |
|---|---|---|---|---|
| 2025 | $4,396 | $342,567 | $137,026 | $205,541 |
| 2024 | $4,396 | $335,850 | $134,339 | $201,511 |
| 2023 | $4,131 | $329,265 | $131,705 | $197,560 |
| 2022 | $4,099 | $322,809 | $129,122 | $193,687 |
| 2021 | $4,055 | $316,480 | $126,590 | $189,890 |
| 2020 | $3,962 | $313,237 | $125,293 | $187,944 |
| 2019 | $3,779 | $307,096 | $122,837 | $184,259 |
| 2018 | $3,738 | $301,076 | $120,429 | $180,647 |
| 2017 | $3,647 | $295,173 | $118,068 | $177,105 |
| 2016 | $3,480 | $289,386 | $115,753 | $173,633 |
| 2015 | $3,399 | $285,041 | $114,015 | $171,026 |
| 2014 | $3,343 | $279,460 | $111,783 | $167,677 |
Source: Public Records
Map
Nearby Homes
- 2241 Burnside St
- 2163 N Justin Ave
- 2146 N Brower St
- 2349 Knollhaven St
- 2266 Lansdale Ct
- 2149 Madrone St
- 2405 Lee St
- 2357 Lawnview Ct
- 2239 McDonald St
- 1775 Lee St
- 2091 Marter Ave
- 2306 Madrone St
- 2410 N Justin Ave
- 2391 Heather St
- 2368 Heywood St
- 1886 Cloud Ct
- 2291 N Marter Ct
- 1882 Larch St
- 2355 E Alden St
- 2149 Clover St
- 2236 Knollhaven St
- 2216 Knollhaven St
- 2235 Burnside St
- 2223 Burnside St
- 2248 Knollhaven St
- 2204 Knollhaven St
- 2229 Knollhaven St
- 2253 Burnside St
- 2219 Burnside St
- 2217 Knollhaven St
- 2237 Knollhaven St
- 2260 Knollhaven St
- 2249 Knollhaven St
- 2205 Knollhaven St
- 2267 Burnside St
- 2274 Knollhaven St
- 2234 Burnside St
- 2230 Graceland St
- 2222 Burnside St
- 2240 Burnside St