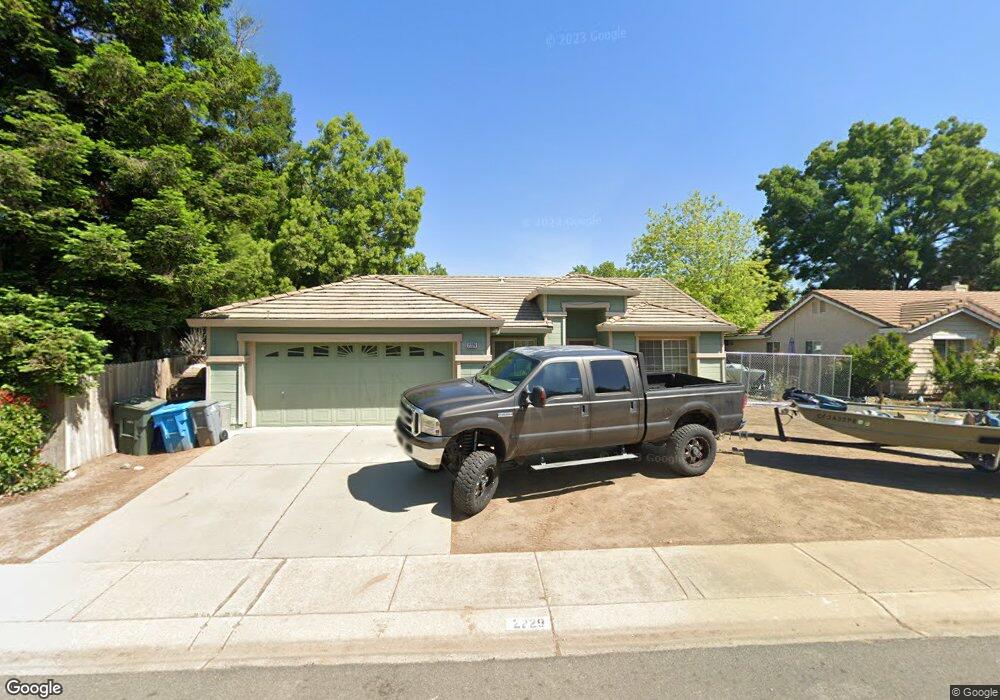
2229 Shady Ln Yuba City, CA 95991
Estimated Value: $146,000 - $396,621
3
Beds
2
Baths
1,360
Sq Ft
$241/Sq Ft
Est. Value
About This Home
This home is located at 2229 Shady Ln, Yuba City, CA 95991 and is currently estimated at $327,155, approximately $240 per square foot. 2229 Shady Ln is a home located in Sutter County with nearby schools including Riverbend Elementary School, Yuba City High School, and Yuba City Charter School.
Ownership History
Date
Name
Owned For
Owner Type
Purchase Details
Closed on
Oct 5, 2011
Sold by
Ohri Sean Kumar and Heer Davinder Singh
Bought by
Fortna Richard William
Current Estimated Value
Home Financials for this Owner
Home Financials are based on the most recent Mortgage that was taken out on this home.
Original Mortgage
$132,552
Outstanding Balance
$92,131
Interest Rate
4.5%
Mortgage Type
FHA
Estimated Equity
$235,024
Purchase Details
Closed on
Oct 4, 2011
Sold by
Kang Navneet K
Bought by
Kang Sukhar J
Home Financials for this Owner
Home Financials are based on the most recent Mortgage that was taken out on this home.
Original Mortgage
$132,552
Outstanding Balance
$92,131
Interest Rate
4.5%
Mortgage Type
FHA
Estimated Equity
$235,024
Purchase Details
Closed on
Jul 28, 2011
Sold by
Guerra Anthony Rey and Guerra Teresa Lynn
Bought by
Ohri Sean Kumar and Heer Devender Singh
Create a Home Valuation Report for This Property
The Home Valuation Report is an in-depth analysis detailing your home's value as well as a comparison with similar homes in the area
Home Values in the Area
Average Home Value in this Area
Purchase History
| Date | Buyer | Sale Price | Title Company |
|---|---|---|---|
| Fortna Richard William | $136,000 | Placer Title Company | |
| Kang Sukhar J | -- | Placer Title Company | |
| Ohri Sean Kumar | $99,900 | None Available |
Source: Public Records
Mortgage History
| Date | Status | Borrower | Loan Amount |
|---|---|---|---|
| Open | Fortna Richard William | $132,552 |
Source: Public Records
Tax History Compared to Growth
Tax History
| Year | Tax Paid | Tax Assessment Tax Assessment Total Assessment is a certain percentage of the fair market value that is determined by local assessors to be the total taxable value of land and additions on the property. | Land | Improvement |
|---|---|---|---|---|
| 2025 | $1,845 | $170,814 | $37,676 | $133,138 |
| 2024 | $1,845 | $167,466 | $36,938 | $130,528 |
| 2023 | $1,845 | $164,183 | $36,214 | $127,969 |
| 2022 | $2,378 | $160,964 | $35,504 | $125,460 |
| 2021 | $2,644 | $157,815 | $34,812 | $123,003 |
| 2020 | $2,613 | $156,197 | $34,455 | $121,742 |
| 2019 | $2,566 | $153,135 | $33,780 | $119,355 |
| 2018 | $2,429 | $150,131 | $33,117 | $117,014 |
| 2017 | $2,118 | $147,188 | $32,468 | $114,720 |
Source: Public Records
Map
Nearby Homes
- 2180 Shady Ct
- 2534 Drummond Dr
- 2314 Idaho Way
- 2277 Hamstead Ln
- 503 Millfront Ave
- 528 Millfront Ave
- 330 Mosburg Loop
- 683 Stewart Rd
- 1640 Southpointe Dr
- 0 Morgan Estates Dr
- 1563 Del Lago
- 3013 Railroad Ave
- 2193 Gerald Ct
- 1744 Franquette Dr
- 1325 Delone Dr
- 1155 Larry Way
- 925 Starlite Ln
- 1031 Celestial Way
- 750 Lincoln Rd Unit 82
- 0 Walnut Ave