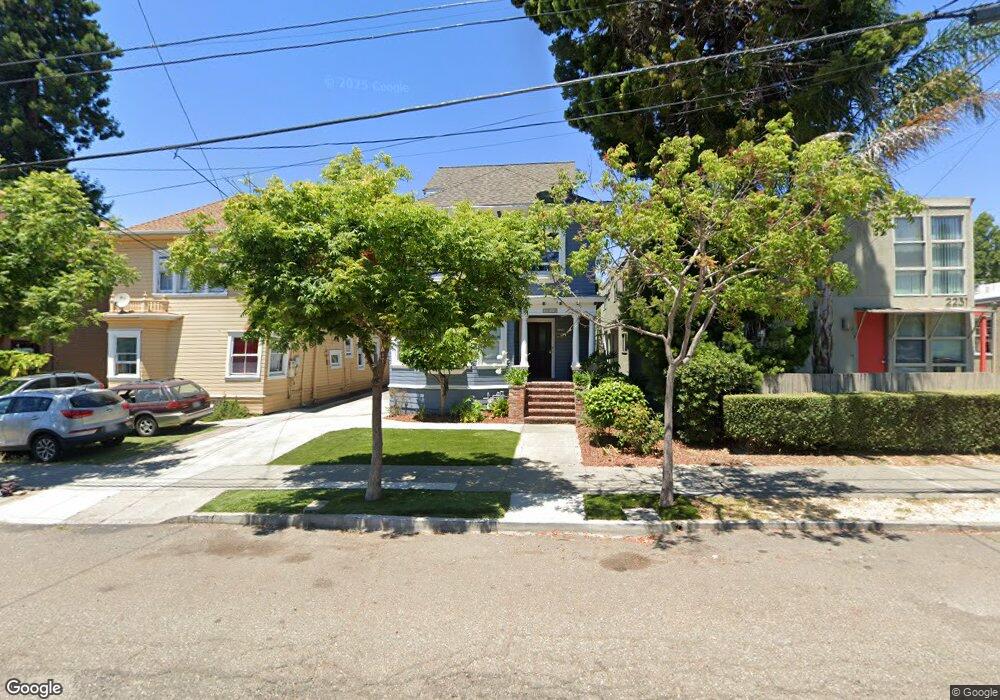
2229 Ward St Berkeley, CA 94705
South Berkeley NeighborhoodEstimated Value: $1,208,000 - $1,821,000
Studio
3
Baths
2,987
Sq Ft
$523/Sq Ft
Est. Value
About This Home
This home is located at 2229 Ward St, Berkeley, CA 94705 and is currently estimated at $1,561,794, approximately $522 per square foot. 2229 Ward St is a home located in Alameda County with nearby schools including Emerson Elementary School, Malcolm X Elementary School, and John Muir Elementary School.
Ownership History
Date
Name
Owned For
Owner Type
Purchase Details
Closed on
Mar 11, 2022
Sold by
Farrokh And Linda Shehabi Trust
Bought by
R Randolph Scott Trust
Current Estimated Value
Purchase Details
Closed on
Apr 1, 2009
Sold by
Shehabi Linda M
Bought by
Shehabi Farrokh
Home Financials for this Owner
Home Financials are based on the most recent Mortgage that was taken out on this home.
Original Mortgage
$55,000
Interest Rate
5.04%
Mortgage Type
Seller Take Back
Purchase Details
Closed on
Jan 15, 2002
Sold by
Privat Gilman Steve and Privat Gilman Carmen
Bought by
Excel Education Foundation Inc
Home Financials for this Owner
Home Financials are based on the most recent Mortgage that was taken out on this home.
Original Mortgage
$609,375
Interest Rate
7.11%
Mortgage Type
Commercial
Create a Home Valuation Report for This Property
The Home Valuation Report is an in-depth analysis detailing your home's value as well as a comparison with similar homes in the area
Home Values in the Area
Average Home Value in this Area
Purchase History
| Date | Buyer | Sale Price | Title Company |
|---|---|---|---|
| R Randolph Scott Trust | $2,000,000 | Old Republic Title | |
| Shehabi Farrokh | -- | Old Republic Title Company | |
| Shehabi Farrokh | $929,000 | Old Republic Title Company | |
| Excel Education Foundation Inc | $650,000 | Old Republic Title Company |
Source: Public Records
Mortgage History
| Date | Status | Borrower | Loan Amount |
|---|---|---|---|
| Previous Owner | Shehabi Farrokh | $55,000 | |
| Previous Owner | Excel Education Foundation Inc | $609,375 |
Source: Public Records
Tax History
| Year | Tax Paid | Tax Assessment Tax Assessment Total Assessment is a certain percentage of the fair market value that is determined by local assessors to be the total taxable value of land and additions on the property. | Land | Improvement |
|---|---|---|---|---|
| 2025 | $30,159 | $2,122,400 | $636,720 | $1,485,680 |
| 2024 | $30,159 | $2,080,800 | $624,240 | $1,456,560 |
| 2023 | $29,560 | $2,040,000 | $612,000 | $1,428,000 |
| 2022 | $18,464 | $1,127,267 | $338,180 | $789,087 |
| 2021 | $18,495 | $1,105,165 | $331,549 | $773,616 |
| 2020 | $17,438 | $1,093,841 | $328,152 | $765,689 |
| 2019 | $16,686 | $1,072,400 | $321,720 | $750,680 |
| 2018 | $16,394 | $1,051,377 | $315,413 | $735,964 |
| 2017 | $15,822 | $1,030,761 | $309,228 | $721,533 |
| 2016 | $15,279 | $1,010,556 | $303,167 | $707,389 |
| 2015 | $15,070 | $995,385 | $298,615 | $696,770 |
| 2014 | $15,079 | $975,895 | $292,768 | $683,127 |
Source: Public Records
Map
Nearby Homes
- 2319 Ward St
- 2702 Dana St
- 2123 Oregon St
- 2550 Dana St Unit 2F
- 2923 Wheeler St
- 2243 Ashby Ave
- 2917 Telegraph Ave
- 2535 Chilton Way
- 2018 Blake St
- 2110 Ashby Ave
- 2935 Florence St
- 3046 Deakin St
- 2057 Emerson St
- 2509 Dwight Way
- 1901 Parker St Unit 3
- 2643 Stuart St
- 2701 Grant St
- 2477 Prince St
- 629 66th St
- 2601 College Ave Unit 203
Your Personal Tour Guide
Ask me questions while you tour the home.