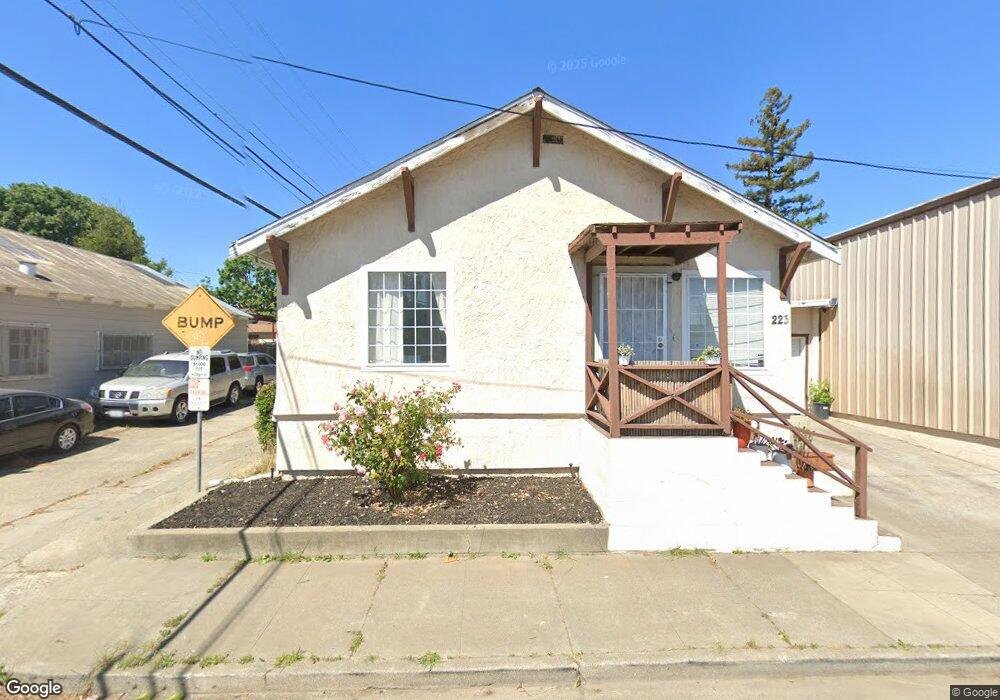
223 Broadway St Vallejo, CA 94590
West Vallejo NeighborhoodEstimated Value: $338,000 - $439,000
2
Beds
1
Bath
909
Sq Ft
$418/Sq Ft
Est. Value
About This Home
This home is located at 223 Broadway St, Vallejo, CA 94590 and is currently estimated at $380,229, approximately $418 per square foot. 223 Broadway St is a home located in Solano County with nearby schools including Highland Elementary, Vallejo High School, and Caliber: ChangeMakers Academy.
Ownership History
Date
Name
Owned For
Owner Type
Purchase Details
Closed on
Aug 18, 2009
Sold by
Tan Zi Ming
Bought by
Tan Xi Mei
Current Estimated Value
Purchase Details
Closed on
Aug 11, 2009
Sold by
Aurora Loan Services Llc
Bought by
Tan Xi Mei
Purchase Details
Closed on
Jun 2, 2009
Sold by
Gomez Tamara
Bought by
Aurora Loan Services Llc
Purchase Details
Closed on
Jun 21, 2005
Sold by
Poyser William E
Bought by
Gomez Tamara
Home Financials for this Owner
Home Financials are based on the most recent Mortgage that was taken out on this home.
Original Mortgage
$264,000
Interest Rate
1%
Mortgage Type
Purchase Money Mortgage
Purchase Details
Closed on
Jan 8, 2001
Sold by
Nicolai Charles D
Bought by
Poyser William E
Purchase Details
Closed on
Oct 4, 1993
Sold by
Great Western Bank
Bought by
Nicolai Charles D and Poyser William E
Home Financials for this Owner
Home Financials are based on the most recent Mortgage that was taken out on this home.
Original Mortgage
$47,250
Interest Rate
6.75%
Create a Home Valuation Report for This Property
The Home Valuation Report is an in-depth analysis detailing your home's value as well as a comparison with similar homes in the area
Home Values in the Area
Average Home Value in this Area
Purchase History
| Date | Buyer | Sale Price | Title Company |
|---|---|---|---|
| Tan Xi Mei | -- | Commerce Title Company | |
| Tan Xi Mei | $64,000 | Commerce Title Company | |
| Aurora Loan Services Llc | $304,314 | Accommodation | |
| Gomez Tamara | $354,000 | Frontier Title Co | |
| Poyser William E | -- | -- | |
| Nicolai Charles D | $52,500 | -- |
Source: Public Records
Mortgage History
| Date | Status | Borrower | Loan Amount |
|---|---|---|---|
| Previous Owner | Gomez Tamara | $264,000 | |
| Previous Owner | Nicolai Charles D | $47,250 |
Source: Public Records
Tax History Compared to Growth
Tax History
| Year | Tax Paid | Tax Assessment Tax Assessment Total Assessment is a certain percentage of the fair market value that is determined by local assessors to be the total taxable value of land and additions on the property. | Land | Improvement |
|---|---|---|---|---|
| 2025 | $2,044 | $82,599 | $25,810 | $56,789 |
| 2024 | $2,044 | $80,980 | $25,304 | $55,676 |
| 2023 | $1,873 | $79,393 | $24,808 | $54,585 |
| 2022 | $1,761 | $77,837 | $24,322 | $53,515 |
| 2021 | $1,720 | $76,312 | $23,846 | $52,466 |
| 2020 | $1,701 | $75,531 | $23,602 | $51,929 |
| 2019 | $1,625 | $74,051 | $23,140 | $50,911 |
| 2018 | $1,504 | $72,600 | $22,687 | $49,913 |
| 2017 | $1,413 | $71,178 | $22,243 | $48,935 |
| 2016 | $841 | $69,783 | $21,807 | $47,976 |
| 2015 | $831 | $68,736 | $21,480 | $47,256 |
| 2014 | $820 | $67,391 | $21,060 | $46,331 |
Source: Public Records
Map
Nearby Homes