Estimated Value: $219,780 - $317,000
--
Bed
--
Bath
1,854
Sq Ft
$150/Sq Ft
Est. Value
About This Home
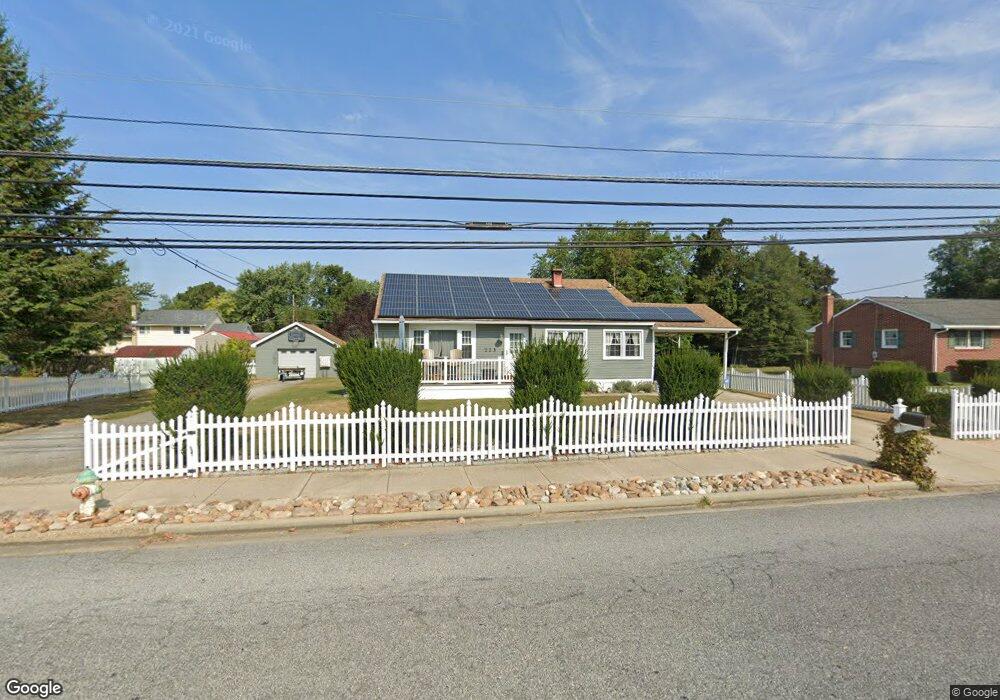
This home is located at 223 Chestnut St, Salem, NJ 08079 and is currently estimated at $277,445, approximately $149 per square foot. 223 Chestnut St is a home located in Salem County with nearby schools including John Fenwick Elementary School, Salem Middle School, and Salem High School.
Ownership History
Date
Name
Owned For
Owner Type
Purchase Details
Closed on
Nov 18, 2005
Sold by
Smith Harry S and Smith Elizabeth M
Bought by
Ayars John F and Ayars Karen L
Current Estimated Value
Home Financials for this Owner
Home Financials are based on the most recent Mortgage that was taken out on this home.
Original Mortgage
$149,600
Outstanding Balance
$82,119
Interest Rate
6.07%
Mortgage Type
New Conventional
Estimated Equity
$195,326
Purchase Details
Closed on
Sep 26, 2003
Sold by
Trader William B and Trader Lillie C
Bought by
Smith Harry S and Smith Elizabeth M
Create a Home Valuation Report for This Property
The Home Valuation Report is an in-depth analysis detailing your home's value as well as a comparison with similar homes in the area
Home Values in the Area
Average Home Value in this Area
Purchase History
| Date | Buyer | Sale Price | Title Company |
|---|---|---|---|
| Ayars John F | $157,500 | -- | |
| Smith Harry S | $85,000 | Salem Oak Title Agency Inc |
Source: Public Records
Mortgage History
| Date | Status | Borrower | Loan Amount |
|---|---|---|---|
| Open | Ayars John F | $149,600 |
Source: Public Records
Tax History Compared to Growth
Tax History
| Year | Tax Paid | Tax Assessment Tax Assessment Total Assessment is a certain percentage of the fair market value that is determined by local assessors to be the total taxable value of land and additions on the property. | Land | Improvement |
|---|---|---|---|---|
| 2025 | $7,614 | $92,600 | $32,800 | $59,800 |
| 2024 | $7,279 | $92,600 | $32,800 | $59,800 |
| 2023 | $7,279 | $92,600 | $32,800 | $59,800 |
| 2022 | $6,961 | $92,600 | $32,800 | $59,800 |
| 2021 | $6,721 | $92,600 | $32,800 | $59,800 |
| 2020 | $6,586 | $92,600 | $32,800 | $59,800 |
| 2019 | $6,546 | $92,600 | $32,800 | $59,800 |
| 2018 | $6,402 | $92,600 | $32,800 | $59,800 |
| 2017 | $6,325 | $92,600 | $32,800 | $59,800 |
| 2016 | $4,308 | $110,000 | $43,200 | $66,800 |
| 2015 | $4,253 | $110,000 | $43,200 | $66,800 |
| 2014 | $6,104 | $158,700 | $43,200 | $115,500 |
Source: Public Records
Map
Nearby Homes
- 10 Delaware Dr
- 249 Chestnut St
- 40 Morning Side Dr
- 251 Chestnut St
- 0 Crossland Ave
- 197 Pine Ave
- 179 Victory Ave
- 75 Hedge St Unit 2 RR
- 304 New Market St
- 9 S Tilbury Rd
- 217 Smith St
- 12 Oak St
- 60 62 Walnut St
- 87-89 W Broadway
- 46 Walnut St
- 210 Wesley St
- 4 Belden St
- 4 Walnut St
- 12 Church St
- 68 Amwellbury Rd
- 229 Chestnut St
- 219 Chestnut St Unit 221
- 227 Chestnut St
- 11 Delaware Dr
- 15 Delaware Dr
- 217 Chestnut St
- 9 Delaware Dr
- 19 Delaware Dr
- 12 Delaware Dr
- 233 Chestnut St
- 1 Delaware Dr
- 215 Chestnut St
- 16 Delaware Dr
- 21 Delaware Dr
- 235 Chestnut St
- 3 Plasket Ave
- 24 Delaware Dr
- 25 Delaware Dr
- 8 Delaware Dr
- 210 Chestnut St