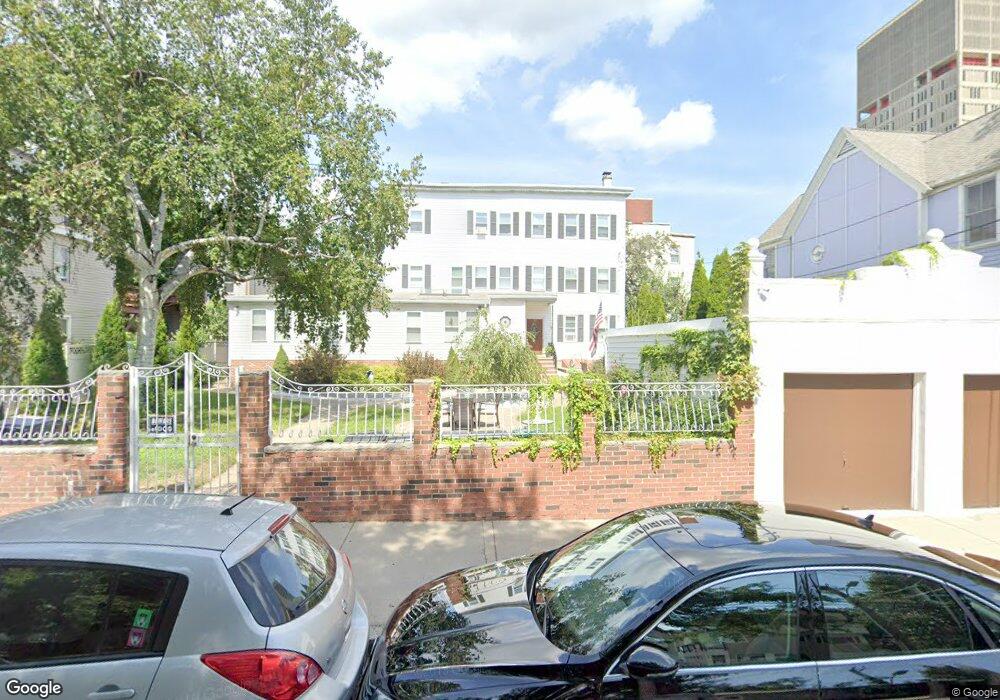
223 Hurley St Unit 1 Cambridge, MA 02141
East Cambridge NeighborhoodEstimated Value: $1,384,000 - $1,909,424
About This Home
Located in highly sought after Kendall Square, this 2 level contemporary, bright & spacious condo has it all! Open and inviting floor plan, blended kitchen dining living room with gas fireplace on first floor. More space on lower level for family room, office etc. Also on lower level, second full bathroom and laundry room. Gleaming hardwood floors were just refinished. Freshly painted and both bathrooms just updated. Central AC. One off street parking spot. Pet friendly. Close to MIT, Lechmere T station, Charles River, Museum of Science, Mass General Hospital, Cambridge side Galleria Mall and many popular restaurants & cafe's. Easy highway access and near dog park for your furry friend! Don't miss them absolute gem!
73226 603
Ownership History
Purchase Details
Purchase Details
Home Values in the Area
Average Home Value in this Area
Purchase History
| Date | Buyer | Sale Price | Title Company |
|---|---|---|---|
| Laura M Vellucci Ret | -- | -- | |
| Vellucci Laura M | -- | -- |
Property History
| Date | Event | Price | List to Sale | Price per Sq Ft |
|---|---|---|---|---|
| 10/31/2024 10/31/24 | Off Market | $4,200 | -- | -- |
| 09/27/2024 09/27/24 | For Rent | $4,200 | -- | -- |
Tax History Compared to Growth
Tax History
| Year | Tax Paid | Tax Assessment Tax Assessment Total Assessment is a certain percentage of the fair market value that is determined by local assessors to be the total taxable value of land and additions on the property. | Land | Improvement |
|---|---|---|---|---|
| 2025 | $8,791 | $1,384,400 | $0 | $1,384,400 |
| 2024 | $7,597 | $1,283,200 | $0 | $1,283,200 |
| 2023 | $6,890 | $1,175,700 | $0 | $1,175,700 |
| 2022 | $6,870 | $1,160,500 | $0 | $1,160,500 |
| 2021 | $6,576 | $1,124,100 | $0 | $1,124,100 |
| 2020 | $6,094 | $1,059,900 | $0 | $1,059,900 |
| 2019 | $5,869 | $988,000 | $0 | $988,000 |
| 2018 | $5,737 | $912,100 | $0 | $912,100 |
| 2017 | $5,709 | $879,600 | $0 | $879,600 |
| 2016 | $5,735 | $820,500 | $0 | $820,500 |
| 2015 | $5,648 | $722,300 | $0 | $722,300 |
| 2014 | $5,504 | $656,800 | $0 | $656,800 |
Map
- 133 Charles St Unit 133
- 76-78 Thorndike St
- 50 Spring St
- 95 2nd St Unit 3
- 30 2nd St Unit 2
- 30 2nd St Unit 1
- 30 2nd St Unit 1 & 2
- 68 Gore St
- 36 Sciarappa St
- 17 Otis St Unit 602
- 25 6th St
- 59 7th St Unit 2
- 59 7th St Unit 1
- 59 7th St Unit 3
- 71 Fulkerson St Unit 206
- 170 Gore St Unit 502
- 170 Gore St Unit 113
- 10 Rogers St Unit 308
- 10 Rogers St Unit 415
- 10 Rogers St Unit 231
- 223 Hurley St Unit 3
- 223 Hurley St Unit 2
- 223 Hurley St
- 223 Hurley St Unit B
- 229 Hurley St Unit 3
- 229 Hurley St Unit 2
- 229 Hurley St Unit 1
- 213 Hurley St
- 227 Hurley St Unit 3
- 227 Hurley St Unit 2
- 227 Hurley St Unit 1
- 227 Hurley St
- 227 Hurley St Unit 2,227
- 106 Sciarappa St
- 106 Sciarappa St
- 106 Sciarappa St Unit 105 - 1R
- 106 Sciarappa St Unit 1R
- 235 Hurley St
- 235 Hurley St Unit 1
- 110 Sciarappa St