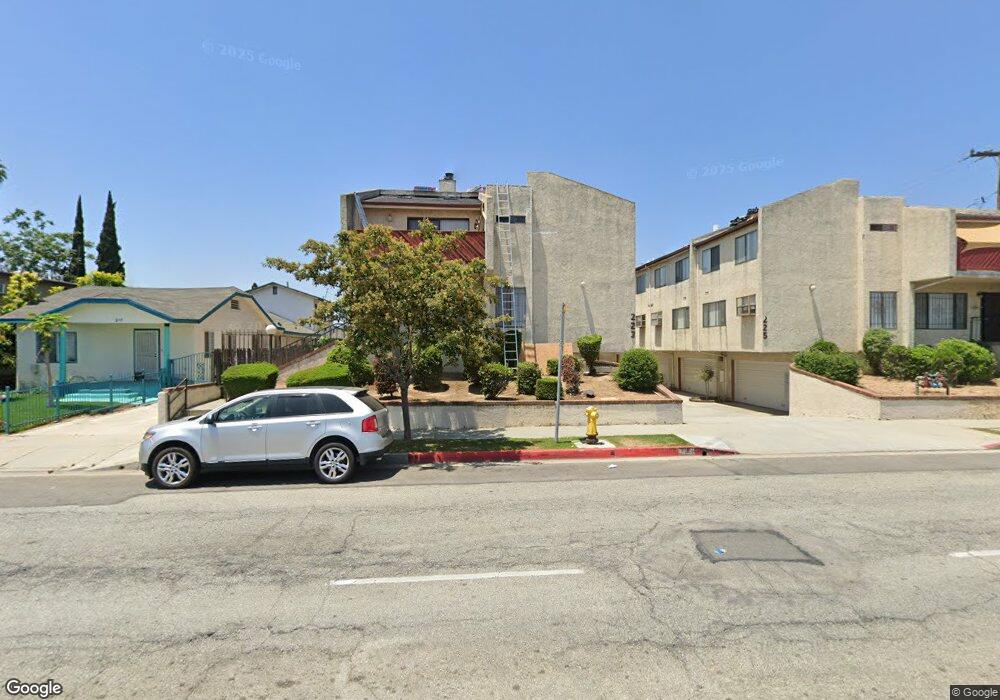
223 N New Ave Unit E Monterey Park, CA 91755
Estimated Value: $700,000 - $747,000
3
Beds
3
Baths
1,476
Sq Ft
$492/Sq Ft
Est. Value
About This Home
This home is located at 223 N New Ave Unit E, Monterey Park, CA 91755 and is currently estimated at $726,273, approximately $492 per square foot. 223 N New Ave Unit E is a home located in Los Angeles County with nearby schools including Monterey Vista Elementary School, Garvey (Richard) Intermediate School, and Mark Keppel High School.
Ownership History
Date
Name
Owned For
Owner Type
Purchase Details
Closed on
Jun 22, 2016
Sold by
Liu Shu Jun
Bought by
Hu Jie and Chen Xiaofeng
Current Estimated Value
Purchase Details
Closed on
Sep 9, 2011
Sold by
Li Xueqi
Bought by
Liu Shu Jun
Home Financials for this Owner
Home Financials are based on the most recent Mortgage that was taken out on this home.
Original Mortgage
$217,200
Interest Rate
5.5%
Mortgage Type
New Conventional
Purchase Details
Closed on
Aug 22, 2011
Sold by
Mohr Johnny Tai and Mohr Selina Pai Ying
Bought by
Liu Shu Jun
Home Financials for this Owner
Home Financials are based on the most recent Mortgage that was taken out on this home.
Original Mortgage
$217,200
Interest Rate
5.5%
Mortgage Type
New Conventional
Purchase Details
Closed on
Jul 3, 2006
Sold by
Ru Sidney and Mohr Sissy Chyong Jong
Bought by
Ru Sidney
Purchase Details
Closed on
Apr 13, 1995
Sold by
Mohr Johnny and Mohr Selina
Bought by
Mohr Johnny Tai
Purchase Details
Closed on
Mar 19, 1993
Sold by
Shieh Raymond
Bought by
Ru Sidney
Create a Home Valuation Report for This Property
The Home Valuation Report is an in-depth analysis detailing your home's value as well as a comparison with similar homes in the area
Home Values in the Area
Average Home Value in this Area
Purchase History
| Date | Buyer | Sale Price | Title Company |
|---|---|---|---|
| Hu Jie | $450,000 | Title 365 | |
| Liu Shu Jun | -- | Fatcola | |
| Liu Shu Jun | $362,000 | Fatcola | |
| Ru Sidney | -- | None Available | |
| Mohr Johnny Tai | -- | -- | |
| Ru Sidney | -- | -- |
Source: Public Records
Mortgage History
| Date | Status | Borrower | Loan Amount |
|---|---|---|---|
| Previous Owner | Liu Shu Jun | $217,200 |
Source: Public Records
Tax History
| Year | Tax Paid | Tax Assessment Tax Assessment Total Assessment is a certain percentage of the fair market value that is determined by local assessors to be the total taxable value of land and additions on the property. | Land | Improvement |
|---|---|---|---|---|
| 2025 | $7,235 | $532,699 | $294,051 | $238,648 |
| 2024 | $7,235 | $522,255 | $288,286 | $233,969 |
| 2023 | $6,992 | $512,016 | $282,634 | $229,382 |
| 2022 | $6,673 | $501,978 | $277,093 | $224,885 |
| 2021 | $6,640 | $492,136 | $271,660 | $220,476 |
| 2019 | $6,391 | $477,541 | $263,603 | $213,938 |
| 2018 | $6,371 | $468,179 | $258,435 | $209,744 |
| 2016 | $5,041 | $384,094 | $201,066 | $183,028 |
| 2015 | $4,942 | $378,325 | $198,046 | $180,279 |
| 2014 | $4,876 | $370,915 | $194,167 | $176,748 |
Source: Public Records
Map
Nearby Homes
- 2712 New Ave
- 825 E Newmark Ave Unit A
- 829 Hershey Ave
- 332 S Orange Ave Unit E
- 417 E Emerson Ave
- 7639 Hellman Ave
- 7838 Whitmore St
- 438 E Newmark Ave Unit A
- 431 N Alhambra Ave Unit B
- 504 S Orange Ave
- 201 N Nicholson Ave
- 303 N Nicholson Ave Unit 307
- 303 N Nicholson Ave Unit 312
- 205 N Nicholson Ave
- 195 N Nicholson Ave
- 203 N Nicholson Ave
- 7902 Hershey St
- 527 S Orange Ave Unit B
- 1023 Mooney Dr
- 223 E Emerson Ave
- 225 N New Ave Unit F
- 225 N New Ave Unit E
- 225 N New Ave Unit D
- 225 N New Ave Unit C
- 225 N New Ave Unit B
- 225 N New Ave Unit A
- 223 N New Ave Unit F
- 223 N New Ave Unit D
- 223 N New Ave Unit C
- 223 N New Ave Unit B
- 223 N New Ave Unit A
- 217 N New Ave
- 233 N New Ave
- 303 N New Ave
- 222 Elizabeth Ave
- 228 Elizabeth Ave
- 218 Elizabeth Ave
- 300 Elizabeth Ave
- 211 N New Ave
- 307 N New Ave
Your Personal Tour Guide
Ask me questions while you tour the home.