223 S 3rd St Benton, AR 72015
Estimated Value: $14,000 - $183,000
Studio
1
Bath
1,188
Sq Ft
$70/Sq Ft
Est. Value
About This Home
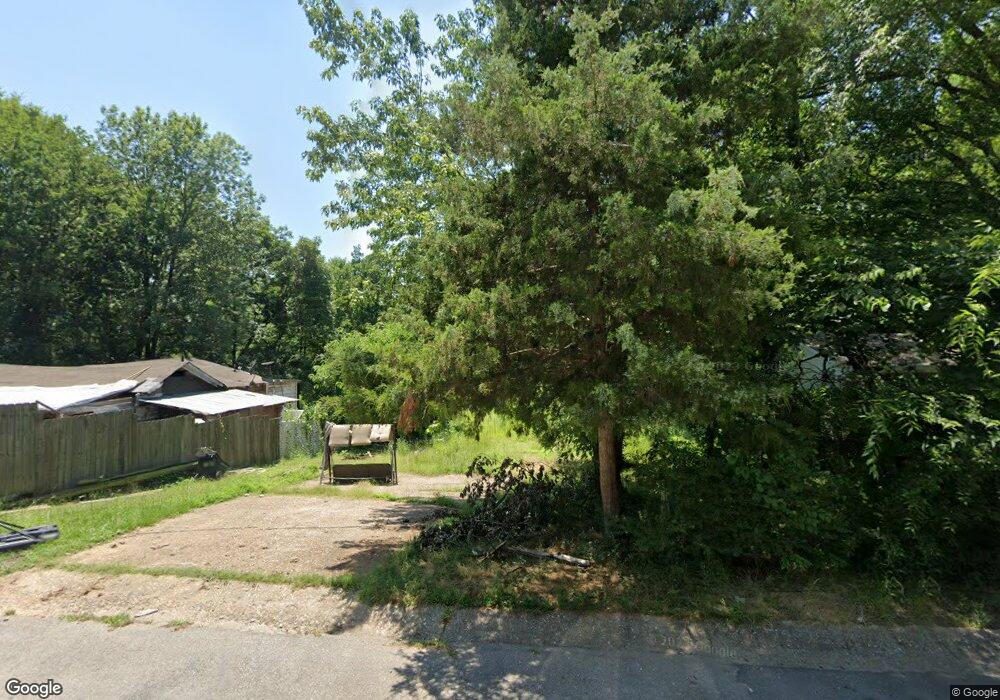
This home is located at 223 S 3rd St, Benton, AR 72015 and is currently estimated at $82,810, approximately $69 per square foot. 223 S 3rd St is a home located in Saline County with nearby schools including Angie Grant Elementary School, Benton Middle School, and Benton Junior High School.
Ownership History
Date
Name
Owned For
Owner Type
Purchase Details
Closed on
Apr 14, 2017
Sold by
Lorenson Joshua D
Bought by
Parker Dennis E and Parker Barbara J
Current Estimated Value
Purchase Details
Closed on
Jan 28, 2010
Sold by
Federal National Mortgage Association
Bought by
Lorenson Joshua D
Purchase Details
Closed on
Dec 8, 2009
Sold by
Gribble Dorothy Thatcher and Thatcher Dorothy
Bought by
Federal National Mortgage Association
Purchase Details
Closed on
Oct 20, 2000
Bought by
Gribble
Purchase Details
Closed on
Mar 9, 1998
Bought by
Gribble
Purchase Details
Closed on
Mar 1, 1992
Bought by
Gribble
Purchase Details
Closed on
Sep 1, 1990
Bought by
Masoner To
Create a Home Valuation Report for This Property
The Home Valuation Report is an in-depth analysis detailing your home's value as well as a comparison with similar homes in the area
Home Values in the Area
Average Home Value in this Area
Purchase History
| Date | Buyer | Sale Price | Title Company |
|---|---|---|---|
| Parker Dennis E | $6,000 | None Available | |
| Lorenson Joshua D | -- | -- | |
| Federal National Mortgage Association | $46,936 | -- | |
| Gribble | -- | -- | |
| Gribble | $36,000 | -- | |
| Gribble | -- | -- | |
| Masoner To | -- | -- |
Source: Public Records
Tax History
| Year | Tax Paid | Tax Assessment Tax Assessment Total Assessment is a certain percentage of the fair market value that is determined by local assessors to be the total taxable value of land and additions on the property. | Land | Improvement |
|---|---|---|---|---|
| 2025 | $111 | $2,000 | $2,000 | -- |
| 2024 | $113 | $2,000 | $2,000 | -- |
| 2023 | $111 | $2,000 | $2,000 | $0 |
| 2022 | $111 | $2,000 | $2,000 | $0 |
| 2021 | $78 | $1,400 | $1,400 | $0 |
| 2020 | $78 | $1,400 | $1,400 | $0 |
| 2019 | $78 | $1,400 | $1,400 | $0 |
| 2018 | $77 | $1,400 | $1,400 | $0 |
| 2017 | $77 | $1,400 | $1,400 | $0 |
| 2016 | $619 | $10,920 | $1,400 | $9,520 |
| 2015 | -- | $10,920 | $1,400 | $9,520 |
| 2014 | $613 | $10,590 | $1,400 | $9,190 |
Source: Public Records
Map
Nearby Homes