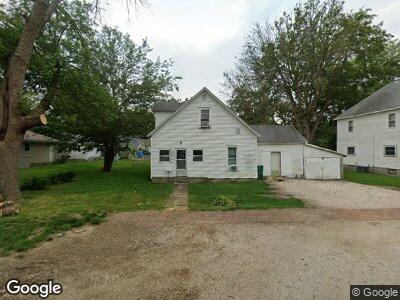
223 W Montgomery St Niantic, IL 62551
Estimated Value: $49,148 - $130,000
3
Beds
1
Bath
880
Sq Ft
$111/Sq Ft
Est. Value
About This Home
This home is located at 223 W Montgomery St, Niantic, IL 62551 and is currently estimated at $97,537, approximately $110 per square foot. 223 W Montgomery St is a home located in Macon County.
Ownership History
Date
Name
Owned For
Owner Type
Purchase Details
Closed on
Jun 12, 2024
Sold by
Endrizzi Equipment Llc
Bought by
E Llc
Current Estimated Value
Purchase Details
Closed on
May 13, 2019
Sold by
Keppler Jeff and Keppler Sherri
Bought by
Endrizzi Equipment Llc
Purchase Details
Closed on
Dec 11, 2015
Sold by
Hagwood Vera
Bought by
Keppler Jeff and Keppler Sherri
Create a Home Valuation Report for This Property
The Home Valuation Report is an in-depth analysis detailing your home's value as well as a comparison with similar homes in the area
Home Values in the Area
Average Home Value in this Area
Purchase History
| Date | Buyer | Sale Price | Title Company |
|---|---|---|---|
| E Llc | -- | None Listed On Document | |
| Endrizzi Equipment Llc | $16,500 | None Available | |
| Keppler Jeff | $29,000 | None Available |
Source: Public Records
Tax History Compared to Growth
Tax History
| Year | Tax Paid | Tax Assessment Tax Assessment Total Assessment is a certain percentage of the fair market value that is determined by local assessors to be the total taxable value of land and additions on the property. | Land | Improvement |
|---|---|---|---|---|
| 2023 | $1,962 | $23,516 | $2,852 | $20,664 |
| 2022 | $1,882 | $21,747 | $2,638 | $19,109 |
| 2021 | $1,849 | $20,657 | $2,506 | $18,151 |
| 2020 | $1,771 | $19,466 | $2,362 | $17,104 |
| 2019 | $1,771 | $19,466 | $2,362 | $17,104 |
| 2018 | $1,748 | $19,004 | $2,306 | $16,698 |
| 2017 | $1,777 | $19,084 | $2,316 | $16,768 |
| 2016 | $1,786 | $19,061 | $2,313 | $16,748 |
| 2015 | -- | $18,506 | $2,246 | $16,260 |
| 2014 | $665 | $18,323 | $2,224 | $16,099 |
| 2013 | $737 | $18,323 | $2,224 | $16,099 |
Source: Public Records
Map
Nearby Homes
- 177 W Montgomery St
- 0 Julia Ct
- 10864 Cornish Rd
- 13505 W Long Point Rd
- 909 Miles St Unit 1
- 414 5th St
- 418 4th St Unit 1
- 275 N Camp St
- 205 N Camp St
- 0 W Wood St
- 0 W Harristown Blvd Unit 6251050
- 5232 W Main St
- 64 1725th Ave
- 888 S Mckinney Ln
- 261 E 4th St
- 204 S Broad St
- 6044 W Elwin Rd
- 0 W Rock Springs Rd
- 622 E Main St
- 17 Mcintyre St