Estimated Value: $331,890 - $405,000
4
Beds
2
Baths
1,630
Sq Ft
$230/Sq Ft
Est. Value
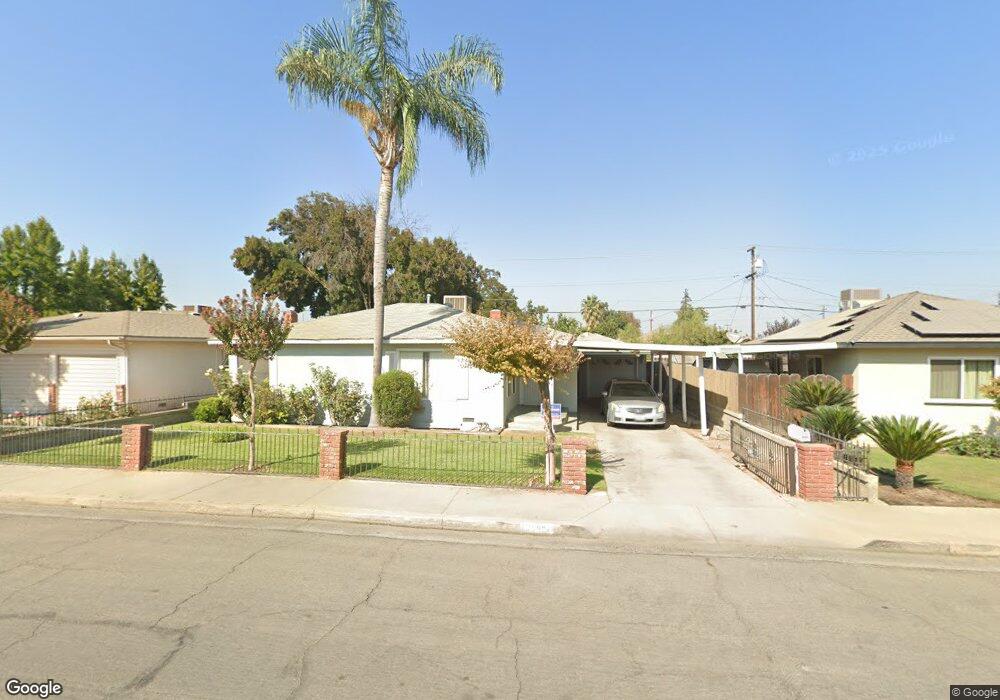
About This Home
This home is located at 2230 Chestnut St, Selma, CA 93662 and is currently estimated at $374,723, approximately $229 per square foot. 2230 Chestnut St is a home located in Fresno County with nearby schools including Theodore Roosevelt Elementary School, Abraham Lincoln Middle School, and Selma High School.
Ownership History
Date
Name
Owned For
Owner Type
Purchase Details
Closed on
Aug 25, 2021
Sold by
Zapata Jerry M
Bought by
Zapata Jerry M and Jerry M Zapata 2021 Trust
Current Estimated Value
Purchase Details
Closed on
Jun 14, 2000
Sold by
Jerry Zapata and Moran Heladia
Bought by
Zapata Jerry M
Home Financials for this Owner
Home Financials are based on the most recent Mortgage that was taken out on this home.
Original Mortgage
$73,500
Outstanding Balance
$26,520
Interest Rate
8.55%
Estimated Equity
$348,203
Purchase Details
Closed on
Feb 1, 1994
Sold by
Murguia Robert S and Murguia Josie O
Bought by
Zapata Jerry and Zapata Heladia Moran
Home Financials for this Owner
Home Financials are based on the most recent Mortgage that was taken out on this home.
Original Mortgage
$93,163
Interest Rate
7.24%
Mortgage Type
FHA
Create a Home Valuation Report for This Property
The Home Valuation Report is an in-depth analysis detailing your home's value as well as a comparison with similar homes in the area
Home Values in the Area
Average Home Value in this Area
Purchase History
| Date | Buyer | Sale Price | Title Company |
|---|---|---|---|
| Zapata Jerry M | -- | None Available | |
| Zapata Jerry M | -- | Fidelity National Title Co | |
| Zapata Jerry | $93,000 | Chicago Title Company |
Source: Public Records
Mortgage History
| Date | Status | Borrower | Loan Amount |
|---|---|---|---|
| Open | Zapata Jerry M | $73,500 | |
| Closed | Zapata Jerry | $93,163 |
Source: Public Records
Tax History
| Year | Tax Paid | Tax Assessment Tax Assessment Total Assessment is a certain percentage of the fair market value that is determined by local assessors to be the total taxable value of land and additions on the property. | Land | Improvement |
|---|---|---|---|---|
| 2025 | $2,800 | $158,033 | $28,873 | $129,160 |
| 2023 | $2,267 | $151,898 | $27,752 | $124,146 |
| 2022 | $2,573 | $148,920 | $27,208 | $121,712 |
| 2021 | $2,508 | $146,001 | $26,675 | $119,326 |
| 2020 | $2,477 | $144,505 | $26,402 | $118,103 |
| 2019 | $2,406 | $141,673 | $25,885 | $115,788 |
| 2018 | $2,348 | $138,896 | $25,378 | $113,518 |
| 2017 | $2,265 | $136,174 | $24,881 | $111,293 |
| 2016 | $2,051 | $133,505 | $24,394 | $109,111 |
| 2015 | $2,079 | $131,501 | $24,028 | $107,473 |
| 2014 | $2,019 | $128,926 | $23,558 | $105,368 |
Source: Public Records
Map
Nearby Homes
- 2221 Floral Ave
- 2232 Gaither St
- 2850 Mccall Ave Unit A-F
- 2002 Merced St
- 12623 S Mccall Ave
- 2629 Mccall Ave
- 2019 Oak St
- 2226 Arrants St
- 2020 Aspen St
- 2841 C St
- 2561 Stillman St Unit 111
- 2222 Barbara St
- 3239 Lee St
- 0 Rose Ave
- 1517 Stillman St
- 2406 B St
- 2772 Valley View St
- 3280 Mccall Ave
- 2591 Rose Ave
- 2980 Olive St
- 2216 Chestnut St
- 2240 Chestnut St
- 2212 Chestnut St
- 2233 Floral Ave
- 2878 Wright St
- 2235 Chestnut St
- 2223 Chestnut St
- 2211 Floral Ave
- 2206 Chestnut St
- 2215 Chestnut St
- 2820 Wright St
- 2209 Chestnut St
- 2875 Logan St
- 2847 Wright St
- 2148 Chestnut St Unit Selma
- 2224 Gaither St
- 2860 Logan St
- 2864 Logan St
- 2240 Gaither St
- 2234 Floral Ave
Your Personal Tour Guide
Ask me questions while you tour the home.